OfficeMax 2009 Annual Report Download - page 22
Download and view the complete annual report
Please find page 22 of the 2009 OfficeMax annual report below. You can navigate through the pages in the report by either clicking on the pages listed below, or by using the keyword search tool below to find specific information within the annual report.-
 1
1 -
2
-
3
-
4
-
5
-
6
-
7
-
8
-
9
-
10
-
11
-
 12
12 -
 13
13 -
 14
14 -
 15
15 -
 16
16 -
 17
17 -
 18
18 -
 19
19 -
 20
20 -
 21
21 -
 22
22 -
 23
23 -
 24
24 -
 25
25 -
 26
26 -
 27
27 -
 28
28 -
 29
29 -
 30
30 -
 31
31 -
 32
32 -
33
-
34
-
35
-
36
-
37
-
38
-
39
-
40
-
41
-
42
-
43
-
44
-
45
-
46
-
47
-
48
-
49
-
50
-
51
-
52
-
53
-
54
-
55
-
56
-
57
-
58
-
59
-
60
-
61
-
62
-
63
-
64
-
65
-
66
-
67
-
68
-
69
-
70
-
71
-
72
-
73
-
74
-
75
-
76
-
77
-
78
-
79
-
80
-
81
-
82
-
83
-
84
-
85
-
86
-
87
-
88
-
89
-
90
-
91
-
92
-
93
-
94
-
95
-
96
-
97
-
98
-
99
-
100
-
101
-
102
-
103
-
104
-
105
-
106
-
107
-
108
-
109
-
110
-
111
-
112
-
113
-
114
-
115
-
116
 |
 |

ITEM 7. MANAGEMENT’S DISCUSSION AND ANALYSIS OF FINANCIAL
CONDITION AND RESULTS OF OPERATIONS
The following discussion contains statements about our future financial performance. These
statements are only predictions. Our actual results may differ materially from these predictions. In
evaluating these statements, you should review ‘‘Item 1A. Risk Factors’’ of this Form 10-K, including
‘‘Cautionary and Forward-Looking Statements.’’
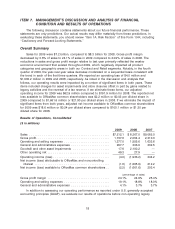
Overall Summary
Sales for 2009 were $7.2 billion, compared to $8.3 billion for 2008. Gross profit margin
decreased by 0.8% of sales to 24.1% of sales in 2009 compared to 24.9% of sales in 2008. The
reductions in sales and gross profit margin relative to last year primarily reflected the weaker
economic environment that existed throughout 2009, which negatively impacted all product
categories and geographic areas in both our Contract and Retail segments. Notably, in the fourth
quarter of 2009, the year-over-year sales decrease moderated on a sequential basis consistent with
the trend in each of the first three quarters. We reported an operating loss of $4.0 million and
$1,936.2 million in 2009 and 2008, respectively. As noted in the discussion and analysis that
follows, our operating results were impacted by a number of significant items in both years. These
items included charges for asset impairments and store closures offset in part by gains related to
legacy activities and the reversal of a tax reserve. If we eliminate these items, our adjusted
operating income for 2009 was $62.9 million compared to $191.9 million for 2008. The reported net
loss available to OfficeMax common shareholders was $2.2 million or $0.03 per diluted share in
2009 compared to $1,661.6 million or $21.90 per diluted share in 2008. If we eliminate the impact of
significant items from both years, adjusted net income available to OfficeMax common shareholders
for 2009 was $18.6 million or $0.24 per diluted share compared to $100.1 million or $1.30 per
diluted share for 2008.
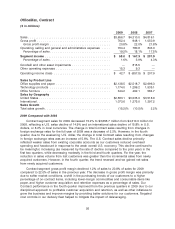
Results of Operations, Consolidated
($ in millions)
2009 2008 2007
Sales ............................................ $7,212.1 $ 8,267.0 $9,082.0
Gross profit ........................................ 1,737.6 2,054.4 2,310.3
Operating and selling expenses ......................... 1,377.0 1,555.6 1,633.6
General and administrative expenses ..................... 297.7 306.9 332.5
Goodwill and other asset impairments .................... 17.6 2,100.2 —
Other operating net .................................. 49.3 27.9 —
Operating income (loss) ............................... (4.0) (1,936.2) 344.2
Net income (loss) attributable to OfficeMax and noncontrolling
interest ......................................... (1.6) (1,665.9) 212.2
Net income (loss) available to OfficeMax common shareholders . . (2.2) (1,661.6) 203.4
(percentage of sales)
Gross profit margin .................................. 24.1% 24.9% 25.4%
Operating and selling expenses ......................... 19.1% 18.8% 18.0%
General and administrative expenses ..................... 4.1% 3.7% 3.7%
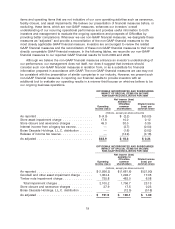
In addition to assessing our operating performance as reported under U.S. generally accepted
accounting principles (GAAP), we evaluate our results of operations before non-operating legacy
18