OfficeMax 2009 Annual Report Download - page 82
Download and view the complete annual report
Please find page 82 of the 2009 OfficeMax annual report below. You can navigate through the pages in the report by either clicking on the pages listed below, or by using the keyword search tool below to find specific information within the annual report.-
 1
1 -
2
-
3
-
4
-
5
-
6
-
7
-
8
-
9
-
10
-
11
-
12
-
13
-
14
-
15
-
16
-
17
-
18
-
19
-
20
-
21
-
22
-
23
-
24
-
25
-
26
-
27
-
28
-
29
-
30
-
31
-
32
-
33
-
34
-
35
-
36
-
37
-
38
-
39
-
40
-
41
-
42
-
43
-
44
-
45
-
46
-
47
-
48
-
49
-
50
-
51
-
52
-
53
-
54
-
55
-
56
-
57
-
58
-
59
-
60
-
61
-
62
-
63
-
64
-
65
-
66
-
67
-
68
-
69
-
70
-
71
-
 72
72 -
 73
73 -
 74
74 -
 75
75 -
 76
76 -
 77
77 -
 78
78 -
 79
79 -
 80
80 -
 81
81 -
 82
82 -
 83
83 -
 84
84 -
 85
85 -
 86
86 -
 87
87 -
 88
88 -
 89
89 -
 90
90 -
 91
91 -
 92
92 -
93
-
94
-
95
-
96
-
97
-
98
-
99
-
100
-
101
-
102
-
103
-
104
-
105
-
106
-
107
-
108
-
109
-
110
-
111
-
112
-
113
-
114
-
115
-
116
 |
 |

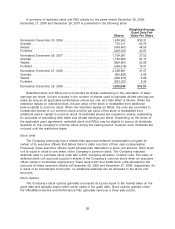
that generally match our expected benefit payments in future years. In selecting bonds for this
theoretical portfolio, we focus on bonds that match cash flows to benefit payments and limit our
concentration of bonds by issuer. To the extent scheduled bond proceeds exceed the estimated
benefit payments in a given period, the yield calculation assumes those excess proceeds are
reinvested at forecasted three-month Treasury bill rates. In 2008 and prior years, we matched our
expected future benefit payments to a hypothetical zero coupon discount curve derived from high
quality corporate bonds. The theoretical portfolio with matching cash flows is a more precise
method for developing a plan specific rate.
The expected long-term rate of return on plan assets assumption is based on the weighted
average of expected returns for the major asset classes in which the plans’ assets are held. Asset-
class expected returns are based on long-term historical returns, inflation expectations, forecasted
gross domestic product and earnings growth, as well as other economic factors. The weights
assigned to each asset class are based on the Company’s investment strategy. The weighted-
average expected return on plan assets used in the calculation of net periodic pension benefit cost
for 2010 is 8.2%.
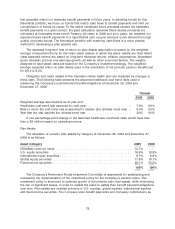
Obligation and costs related to the Canadian retiree health plan are impacted by changes in
trend rates. The following table presents the assumed healthcare cost trend rates used in
measuring the Company’s postretirement benefit obligations at December 26, 2009 and
December 27, 2008:
Canada
2009 2008
Weighted average assumptions as of year-end:
Healthcare cost trend rate assumed for next year ........................ 7.5% 8.0%
Rate to which the cost trend rate is assumed to decline (the ultimate trend rate) . . 5.0% 5.0%
Year that the rate reaches the ultimate trend rate ......................... 2015 2015
A one-percentage-point change in the assumed healthcare cost trend rates would have less
than a $2 million impact on operating income.
Plan Assets
The allocation of pension plan assets by category at December 26, 2009 and December 27,
2008 is as follows:
Asset Category 2009 2008
OfficeMax common stock ......................................... 10.1% —
U.S. equity securities ............................................. 16.9% 19.8%
International equity securities ....................................... 8.7% 8.9%
Global equity securities ........................................... 17.6% 18.1%
Fixed-income securities ........................................... 46.7% 53.2%
100% 100%
The Company’s Retirement Funds Investment Committee is responsible for establishing and
overseeing the implementation of the investment policy for the Company’s pension plans. The
investment policy is structured to optimize growth of the pension plan trust assets, while minimizing
the risk of significant losses, in order to enable the plans to satisfy their benefit payment obligations
over time. Plan assets are invested primarily in U.S. equities, global equities, international equities
and fixed-income securities. The Company uses benefit payments and Company contributions as
78