OfficeMax 2009 Annual Report Download - page 25
Download and view the complete annual report
Please find page 25 of the 2009 OfficeMax annual report below. You can navigate through the pages in the report by either clicking on the pages listed below, or by using the keyword search tool below to find specific information within the annual report.-
 1
1 -
2
-
3
-
4
-
5
-
6
-
7
-
8
-
9
-
10
-
11
-
12
-
13
-
14
-
 15
15 -
 16
16 -
 17
17 -
 18
18 -
 19
19 -
 20
20 -
 21
21 -
 22
22 -
 23
23 -
 24
24 -
 25
25 -
 26
26 -
 27
27 -
 28
28 -
 29
29 -
 30
30 -
 31
31 -
 32
32 -
 33
33 -
 34
34 -
 35
35 -
36
-
37
-
38
-
39
-
40
-
41
-
42
-
43
-
44
-
45
-
46
-
47
-
48
-
49
-
50
-
51
-
52
-
53
-
54
-
55
-
56
-
57
-
58
-
59
-
60
-
61
-
62
-
63
-
64
-
65
-
66
-
67
-
68
-
69
-
70
-
71
-
72
-
73
-
74
-
75
-
76
-
77
-
78
-
79
-
80
-
81
-
82
-
83
-
84
-
85
-
86
-
87
-
88
-
89
-
90
-
91
-
92
-
93
-
94
-
95
-
96
-
97
-
98
-
99
-
100
-
101
-
102
-
103
-
104
-
105
-
106
-
107
-
108
-
109
-
110
-
111
-
112
-
113
-
114
-
115
-
116
 |
 |
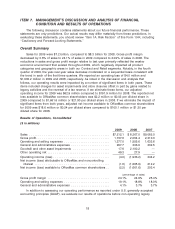
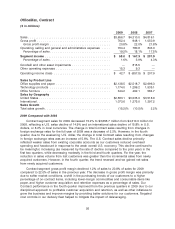
from our vendors but earned overall lower gross margins as a result of softer market conditions as
well as a shift in its customers’ purchasing trends to a higher percentage of lower-margin
consumable items, lower sales of off-contract items, and higher customer acquisition and retention
costs.
Operating and selling expenses increased by 0.3% of sales to 19.1% of sales in 2009 from
18.8% of sales a year earlier. The increased expense was primarily the result of deleveraging of
fixed costs due to lower sales and increased incentive compensation expense, partially offset by
reduced payroll and other targeted cost reductions. Incentive compensation expense included in
operating and selling expense was $23.6 million for 2009 compared to $4.0 million for 2008.
General and administrative expenses increased 0.4% of sales to 4.1% of sales in 2009
compared to 3.7% of sales in 2008. The increase primarily reflected higher pension and incentive
compensation expenses. General and administrative expense included $40.8 million of these costs
in 2009 as compared to $5.1 million in 2008. Excluding these costs, general and administrative
expense was consistent between 2009 and 2008. The effect of deleveraging of expense resulting
from lower sales was offset by lower headcount resulting from a significant reduction in force at the
corporate headquarters in late 2008.
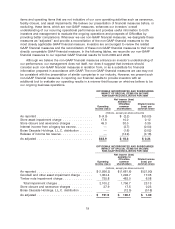
As noted above, our results for 2009 include several significant items, as follows:
• We recognized a non-cash impairment charge of $17.6 million associated with leasehold
improvements and other assets at certain of our Retail stores in the U.S. and Mexico. After
tax and noncontrolling interest, these charges reduced net income (loss) available to
OfficeMax common shareholders by $10.0 million or $0.12 per diluted share.
• We recorded $31.2 million of charges in our Retail segment related to store closures. We
also recorded $18.1 million of severance and other charges, principally related to
reorganizations of our U.S. and Canadian Contract sales forces, customer fulfillment centers
and customer service centers, as well as a streamlining of our Retail store staffing. These
charges are recorded by segment in the following manner: Contract $15.3 million, Retail
$2.1 million and Corporate and Other $0.7 million. After tax and noncontrolling interest, the
cumulative effect of these items was a reduction of net income (loss) available to OfficeMax
common shareholders by $30.0 million, or $0.39 per diluted share.
• ‘‘Other income (expense), net’’ in the Consolidated Statement of Operations includes income
of $2.6 million from a distribution on the Boise Investment related to our tax liability on
allocated earnings. This distribution was much larger in the prior year due to a significant tax
gain realized by Boise Cascade, L.L.C. on the sales of its paper and packaging and
newsprint businesses. After tax, this item increased net income (loss) available to OfficeMax
common shareholders $1.6 million, or $0.02 per diluted share.
• We recorded $4.4 million of interest income related to a tax escrow balance established in a
prior period in connection with our legacy Voyager Panel business which we sold in 2004.
After tax, this item increased net income (loss) available to OfficeMax common shareholders
by $2.7 million, or $0.04 per diluted share.
• In the fourth quarter, we were notified that the U.S. Internal Revenue Service conceded an
issue under appeals regarding the deductibility of interest on certain of our industrial revenue
bonds. Upon the resolution of this matter, we released $14.9 million in tax uncertainty
reserves which increased net income (loss) available to OfficeMax common shareholders by
$0.18 per diluted share.
Interest expense was $76.4 million in 2009 compared to $113.6 million for 2008. The decline in
interest expense was principally due to the Lehman bankruptcy on September 15, 2008, and the
21