OfficeMax 2009 Annual Report Download - page 36
Download and view the complete annual report
Please find page 36 of the 2009 OfficeMax annual report below. You can navigate through the pages in the report by either clicking on the pages listed below, or by using the keyword search tool below to find specific information within the annual report.-
 1
1 -
2
-
3
-
4
-
5
-
6
-
7
-
8
-
9
-
10
-
11
-
12
-
13
-
14
-
15
-
16
-
17
-
18
-
19
-
20
-
21
-
22
-
23
-
24
-
25
-
 26
26 -
 27
27 -
 28
28 -
 29
29 -
 30
30 -
 31
31 -
 32
32 -
 33
33 -
 34
34 -
 35
35 -
 36
36 -
 37
37 -
 38
38 -
 39
39 -
 40
40 -
 41
41 -
 42
42 -
 43
43 -
 44
44 -
 45
45 -
 46
46 -
47
-
48
-
49
-
50
-
51
-
52
-
53
-
54
-
55
-
56
-
57
-
58
-
59
-
60
-
61
-
62
-
63
-
64
-
65
-
66
-
67
-
68
-
69
-
70
-
71
-
72
-
73
-
74
-
75
-
76
-
77
-
78
-
79
-
80
-
81
-
82
-
83
-
84
-
85
-
86
-
87
-
88
-
89
-
90
-
91
-
92
-
93
-
94
-
95
-
96
-
97
-
98
-
99
-
100
-
101
-
102
-
103
-
104
-
105
-
106
-
107
-
108
-
109
-
110
-
111
-
112
-
113
-
114
-
115
-
116
 |
 |

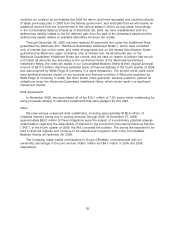
Investment Activities
Our investing activities provided $2.8 million of cash during 2009 compared to a use of funds
of $112.1 million and $138.9 during 2008 and 2007, respectively. During 2009, we received
$25.1 million in cash from the distribution of a tax escrow balance established in a prior period in
connection with our legacy Voyageur Panel business sold in 2004, and $15.0 million related to
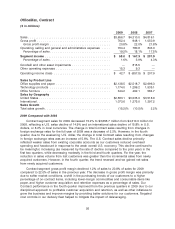
withdrawals from the principal balance of our COLI policies. Our capital spending in 2009 primarily
related to leasehold improvements, 12 new stores and maintenance projects. Details of the capital
investment by segment are included in the following table:
Capital Investment
2009 2008 2007
(millions)
OfficeMax, Contract ....................................... $18.0 $ 34.2 $ 42.5
OfficeMax, Retail ......................................... 20.3 109.8 98.3
38.3 144.0 140.8
We expect our capital investments in 2010 to be approximately $90 to $110 million. Our capital
spending in 2010 will be primarily for technology enhancements such as an upgrade to our
financial systems platform and improvements in the telephony software and hardware used by our
call centers. We will also invest in leasehold improvements and replacement maintenance projects.
In 2010, we expect store openings to be limited to two by our joint venture partner in Mexico.
Financing Activities
Our financing activities used cash of $60.6 million in 2009, $86.1 million in 2008 and
$62.6 million in 2007. Common and preferred dividend payments totaled $3.1 million in 2009,
$47.5 million in 2008, and $49.1 million in 2007. In 2008 and 2007, our quarterly cash dividend was
15 cents per common share. Due to the challenging economic environment, and to conserve cash,
our quarterly cash dividend was suspended in December 2008. We had net debt payments of
$57.7 million, $40.0 million and $11.6 million in 2009, 2008 and 2007 respectively.
Financing Arrangements
We lease our store space and certain other property and equipment under operating leases.
These operating leases are not included in debt; however, they represent a significant commitment.
Our obligations under operating leases are shown in the ‘‘Contractual Obligations’’ section of this
Management’s Discussion and Analysis of Financial Condition and Results of Operations.
Our debt structure consists of credit agreements, note agreements, and other borrowings as
described below. For more information, see the ‘‘Contractual Obligations’’ and ‘‘Disclosures of
Financial Market Risks’’ sections of this Management’s Discussion and Analysis of Financial
Condition and Results of Operations.
Credit Agreements
On July 12, 2007, we entered into a revolving credit agreement (the ‘‘U.S. Credit Agreement’’)
with a group of banks. The U.S. Credit Agreement permits us to borrow up to a maximum of
$700 million subject to a borrowing base calculation that limits availability to a percentage of
eligible accounts receivable plus a percentage of the value of eligible inventory less certain
reserves. The U.S. Credit Agreement may be increased (up to a maximum of $800 million) at our
request or reduced from time to time, in each case according to the terms detailed in the U.S.
Credit Agreement. There were no borrowings outstanding under our U.S. Credit Agreement at the
end of fiscal years 2009 or 2008, and there were no borrowings outstanding under this facility
32