OfficeMax 2009 Annual Report Download - page 53
Download and view the complete annual report
Please find page 53 of the 2009 OfficeMax annual report below. You can navigate through the pages in the report by either clicking on the pages listed below, or by using the keyword search tool below to find specific information within the annual report.-
 1
1 -
2
-
3
-
4
-
5
-
6
-
7
-
8
-
9
-
10
-
11
-
12
-
13
-
14
-
15
-
16
-
17
-
18
-
19
-
20
-
21
-
22
-
23
-
24
-
25
-
26
-
27
-
28
-
29
-
30
-
31
-
32
-
33
-
34
-
35
-
36
-
37
-
38
-
39
-
40
-
41
-
42
-
 43
43 -
 44
44 -
 45
45 -
 46
46 -
 47
47 -
 48
48 -
 49
49 -
 50
50 -
 51
51 -
 52
52 -
 53
53 -
 54
54 -
 55
55 -
 56
56 -
 57
57 -
 58
58 -
 59
59 -
 60
60 -
 61
61 -
 62
62 -
 63
63 -
64
-
65
-
66
-
67
-
68
-
69
-
70
-
71
-
72
-
73
-
74
-
75
-
76
-
77
-
78
-
79
-
80
-
81
-
82
-
83
-
84
-
85
-
86
-
87
-
88
-
89
-
90
-
91
-
92
-
93
-
94
-
95
-
96
-
97
-
98
-
99
-
100
-
101
-
102
-
103
-
104
-
105
-
106
-
107
-
108
-
109
-
110
-
111
-
112
-
113
-
114
-
115
-
116
 |
 |

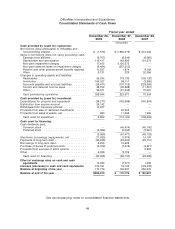
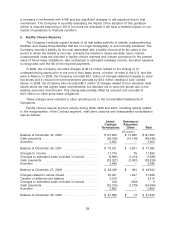
OfficeMax Incorporated and Subsidiaries
Consolidated Statements of Cash Flows
Fiscal year ended
December 26, December 27, December 29,
2009 2008 2007
(thousands)
Cash provided by (used for) operations:
Net income (loss) attributable to OfficeMax and
noncontrolling interest .................... $ (1,575) $ (1,665,919) $ 212,245
Items in net income (loss) not using (providing) cash:
Earnings from affiliates .................... (6,707) (6,246) (6,065)
Depreciation and amortization ............... 116,417 142,896 131,573
Non-cash impairment charges ............... 17,612 2,120,572 —
Non-cash deferred taxes on impairment charges . . (6,484) (357,313) —
Pension and other postretirement benefits expense 11,537 1,874 8,159
Other ................................ 9,131 329 32,096
Changes in operating assets and liabilities:
Receivables ........................... 26,334 119,133 (139,120)
Inventories ............................ 164,027 98,111 (3,585)
Accounts payable and accrued liabilities ........ (56,471) (137,716) (228,269)
Current and deferred income taxes ........... 48,752 (40,698) (11,521)
Other ................................ 36,371 (51,346) 75,091
Cash provided by operations ............... 358,944 223,677 70,604
Cash provided by (used for) investment:
Expenditures for property and equipment ......... (38,277) (143,968) (140,843)
Distribution from escrow account .............. 25,142 — —
Withdrawal from insurance policies ............. 14,977 — —
Proceeds from sale of restricted investments ...... — 20,252 —
Proceeds from sales of assets, net ............. 980 11,592 1,909
Cash used for investment .................. 2,822 (112,124) (138,934)
Cash used for financing:
Cash dividends paid:
Common stock ......................... — (45,474) (45,142)
Preferred stock ......................... (3,089) (2,003) (3,961)
(3,089) (47,477) (49,103)
Short-term borrowings (repayments), net ......... (11,035) (1,974) 14,197
Payments of long-term debt .................. (52,936) (53,944) (25,751)
Borrowings of long-term debt ................. 6,255 15,928 —
Purchase of Series D preferred stock ............ (6,079) (7,376) (4,621)
Proceeds from exercise of stock options ......... — — 2,653
Other ................................. 6,326 8,709 —
Cash used for financing ................... (60,558) (86,134) (62,625)
Effect of exchange rates on cash and cash
equivalents ........................... 14,583 (7,277) 1,522
Increase (decrease) in cash and cash equivalents . 315,791 18,142 (129,433)
Balance at beginning of the year ............. 170,779 152,637 282,070
Balance at end of the year .................. $486,570 $ 170,779 $ 152,637
See accompanying notes to consolidated financial statements
49