NetSpend 2013 Annual Report Download - page 9
Download and view the complete annual report
Please find page 9 of the 2013 NetSpend annual report below. You can navigate through the pages in the report by either clicking on the pages listed below, or by using the keyword search tool below to find specific information within the annual report.-
 1
1 -
 2
2 -
 3
3 -
 4
4 -
 5
5 -
 6
6 -
 7
7 -
 8
8 -
 9
9 -
 10
10 -
 11
11 -
 12
12 -
 13
13 -
 14
14 -
 15
15 -
 16
16 -
 17
17 -
 18
18 -
 19
19 -
 20
20 -
21
-
22
-
23
-
24
-
25
-
26
-
27
-
28
-
29
-
30
-
31
-
32
-
33
-
34
-
35
-
36
-
37
-
38
-
39
-
40
-
41
-
42
-
43
-
44
-
45
-
46
-
47
-
48
-
49
-
50
-
51
-
52
-
53
-
54
-
55
-
56
-
57
-
58
-
59
-
60
-
61
-
62
-
63
-
64
-
65
-
66
-
67
-
68
-
69
-
70
-
71
-
72
-
73
-
74
-
75
-
76
-
77
-
78
-
79
-
80
-
81
-
82
-
83
-
84
 |
 |

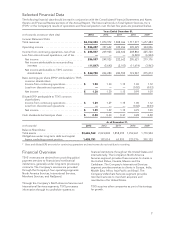
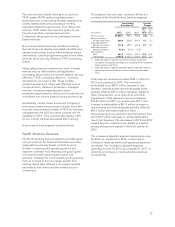
Selected Financial Data
The following financial data should be read in conjunction with the Consolidated Financial Statements and Notes
thereto and Financial Review sections of the Annual Report. The historical trends in Total System Services, Inc.’s
(TSYS’ or the Company’s) results of operations and financial position over the last five years are presented below.
Years Ended December 31,
(in thousands, except per share data) 2013 2012 2011 2010 2009
Income Statement Data:
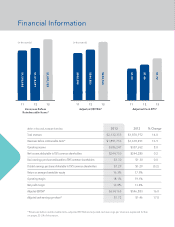
Total revenues ............................... $2,132,353 1,870,972 1,808,966 1,717,577 1,677,483
Operating income ............................ $ 386,247 357,652 322,456 309,429 344,026
Income from continuing operations, net of tax .... $ 256,597 249,923 222,662 208,866 225,720
Loss from discontinued operations, net of tax ..... —— — (3,245) (6,544)
Net income ............................... 256,597 249,923 222,662 205,621 219,176
Net income attributable to noncontrolling
interests ................................ (11,847) (5,643) (2,103) (11,674) (3,963)
Net income attributable to TSYS common
shareholders ............................. $ 244,750 244,280 220,559 193,947 215,213
Basic earnings per share (EPS)* attributable to TSYS
common shareholders:
Income from continuing operations ............ $ 1.30 1.30 1.15 1.00 1.12
Loss from discontinued operations ............ —— — (0.02) (0.03)
Net income ............................... $ 1.30 1.30 1.15 0.99 1.09
Diluted EPS* attributable to TSYS common
shareholders:
Income from continuing operations ............ $ 1.29 1.29 1.15 1.00 1.12
Loss from discontinued operations ............ —— — (0.02) (0.03)
Net income ............................... $ 1.29 1.29 1.15 0.99 1.09
Cash dividends declared per share .............. $ 0.40 0.40 0.31 0.28 0.28
As of December 31,
(in thousands) 2013 2012 2011 2010 2009
Balance Sheet Data:
Total assets ............................... $3,686,568 2,023,838 1,858,392 1,952,261 1,710,954
Obligations under long-term debt and capital
leases, excluding current portion ............ 1,435,751 192,014 63,593 225,276 205,123
* Basic and diluted EPS amounts for continuing operations and net income do not total due to rounding.
Financial Overview
TSYS’ revenues are derived from providing global
payment services to financial and nonfinancial
institutions, generally under long-term processing
contracts. The Company’s services are provided
through the Company’s four operating segments:
North America Services, International Services,
Merchant Services, and NetSpend.
Through the Company’s North America Services and
International Services segments, TSYS processes
information through its cardholder systems to
financial institutions throughout the United States and
internationally. The Company’s North America
Services segment provides these services to clients in
the United States, Canada, Mexico and the
Caribbean. The Company’s International Services
segment provides services to clients in Europe, India,
Middle East, Africa, Asia Pacific and Brazil. The
Company’s Merchant Services segment provides
merchant services to merchant acquirers and
merchants in the United States.
TSYS acquires other companies as part of its strategy
for growth.
7