NetSpend 2013 Annual Report Download - page 27
Download and view the complete annual report
Please find page 27 of the 2013 NetSpend annual report below. You can navigate through the pages in the report by either clicking on the pages listed below, or by using the keyword search tool below to find specific information within the annual report.-
 1
1 -
2
-
3
-
4
-
5
-
6
-
7
-
8
-
9
-
10
-
11
-
12
-
13
-
14
-
15
-
16
-
 17
17 -
 18
18 -
 19
19 -
 20
20 -
 21
21 -
 22
22 -
 23
23 -
 24
24 -
 25
25 -
 26
26 -
 27
27 -
 28
28 -
 29
29 -
 30
30 -
 31
31 -
 32
32 -
 33
33 -
 34
34 -
 35
35 -
 36
36 -
 37
37 -
38
-
39
-
40
-
41
-
42
-
43
-
44
-
45
-
46
-
47
-
48
-
49
-
50
-
51
-
52
-
53
-
54
-
55
-
56
-
57
-
58
-
59
-
60
-
61
-
62
-
63
-
64
-
65
-
66
-
67
-
68
-
69
-
70
-
71
-
72
-
73
-
74
-
75
-
76
-
77
-
78
-
79
-
80
-
81
-
82
-
83
-
84
 |
 |

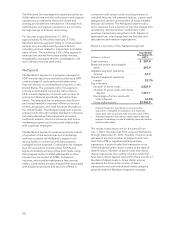
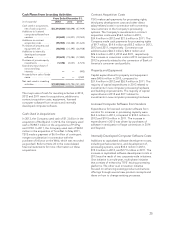
Cash Flows from Investing Activities
Years Ended December 31,
(in thousands) 2013 2012 2011
Cash used in acquisitions,
net of cash acquired .... $(1,314,660) (188,698) (47,909)
Additions to licensed
computer software from
vendors .............. (63,635) (33,001) (19,502)
Additions to contract
acquisition costs ....... (55,965) (34,384) (31,623)
Purchases of property and
equipment, net ........ (40,598) (31,395) (26,938)
Additions to internally
developed computer
software .............. (33,600) (19,285) (17,882)
Purchase of private equity
investments ........... (1,378) (3,031) (1,573)
Subsidiary repurchase of
noncontrolling
interests .............. —— (493)
Proceeds from sale of trade
name ................ —— 4,500
Net cash used in investing
activities .............. $(1,509,836) (309,794) (141,420)
The major uses of cash for investing activities in 2013,
2012 and 2011 were for acquisitions, additions to
contract acquisition costs, equipment, licensed
computer software from vendors and internally
developed computer software.
Cash Used in Acquisitions
In 2013, the Company used cash of $1.3 billion in the
acquisition of NetSpend. In 2012, the Company used
cash of $188.7 million in the acquisitions of ProPay
and CPAY. In 2011, the Company used cash of $42.0
million in the acquisition of TermNet. In May 2011,
TSYS made a payment of $6.0 million of contingent
merger consideration in connection with the
purchase of Infonox on the Web, which was recorded
as goodwill. Refer to Note 23 in the consolidated
financial statements for more information on these
acquisitions.
Contract Acquisition Costs
TSYS makes cash payments for processing rights,
third-party development costs and other direct
salary-related costs in connection with converting
new customers to the Company’s processing
systems. The Company’s investments in contract
acquisition costs were $56.0 million in 2013,
$34.4 million in 2012 and $31.6 million in 2011. The
Company made cash payments for processing rights
of $9.7 million, $14.4 million and $5.2 million in 2013,
2012 and 2011, respectively. Conversion cost
additions were $46.3 million, $20.0 million and
$26.4 million in 2013, 2012 and 2011, respectively.
The increase in conversion costs in 2013 compared to
2012 is primarily related to the conversion of Bank of
America’s consumer card portfolio.
Property and Equipment
Capital expenditures for property and equipment
were $40.6 million in 2013, compared to
$31.4 million in 2012 and $26.9 million in 2011. The
majority of capital expenditures in 2013 related to
investments in new computer processing hardware
and building improvements. The majority of capital
expenditures in 2012 and 2011 related to
investments in new computer processing hardware.
Licensed Computer Software from Vendors
Expenditures for licensed computer software from
vendors for increases in processing capacity were
$63.6 million in 2013, compared to $33.0 million in
2012 and $19.5 million in 2011. The increase in
expenditures in 2013 was driven by purchases of
software in anticipation of large conversions in 2014
and beyond.
Internally Developed Computer Software Costs
Additions to capitalized software development costs,
including enhancements to, and development of,
processing systems, were $33.6 million in 2013,
$19.3 million in 2012, and $17.9 million in 2011. The
increase in capitalized software development costs in
2013 was the result of two corporate-wide initiatives.
One initiative is a multi-year, multi-phase initiative
that consists of enhancing TSYS’ issuing processing
platforms. The other is an innovation initiative
focused on enhancing existing product and service
offerings through several new product concepts and
ideas on how to change existing processes.
25