NetSpend 2013 Annual Report Download - page 51
Download and view the complete annual report
Please find page 51 of the 2013 NetSpend annual report below. You can navigate through the pages in the report by either clicking on the pages listed below, or by using the keyword search tool below to find specific information within the annual report.-
 1
1 -
2
-
3
-
4
-
5
-
6
-
7
-
8
-
9
-
10
-
11
-
12
-
13
-
14
-
15
-
16
-
17
-
18
-
19
-
20
-
21
-
22
-
23
-
24
-
25
-
26
-
27
-
28
-
29
-
30
-
31
-
32
-
33
-
34
-
35
-
36
-
37
-
38
-
39
-
40
-
 41
41 -
 42
42 -
 43
43 -
 44
44 -
 45
45 -
 46
46 -
 47
47 -
 48
48 -
 49
49 -
 50
50 -
 51
51 -
 52
52 -
 53
53 -
 54
54 -
 55
55 -
 56
56 -
 57
57 -
 58
58 -
 59
59 -
 60
60 -
 61
61 -
62
-
63
-
64
-
65
-
66
-
67
-
68
-
69
-
70
-
71
-
72
-
73
-
74
-
75
-
76
-
77
-
78
-
79
-
80
-
81
-
82
-
83
-
84
 |
 |
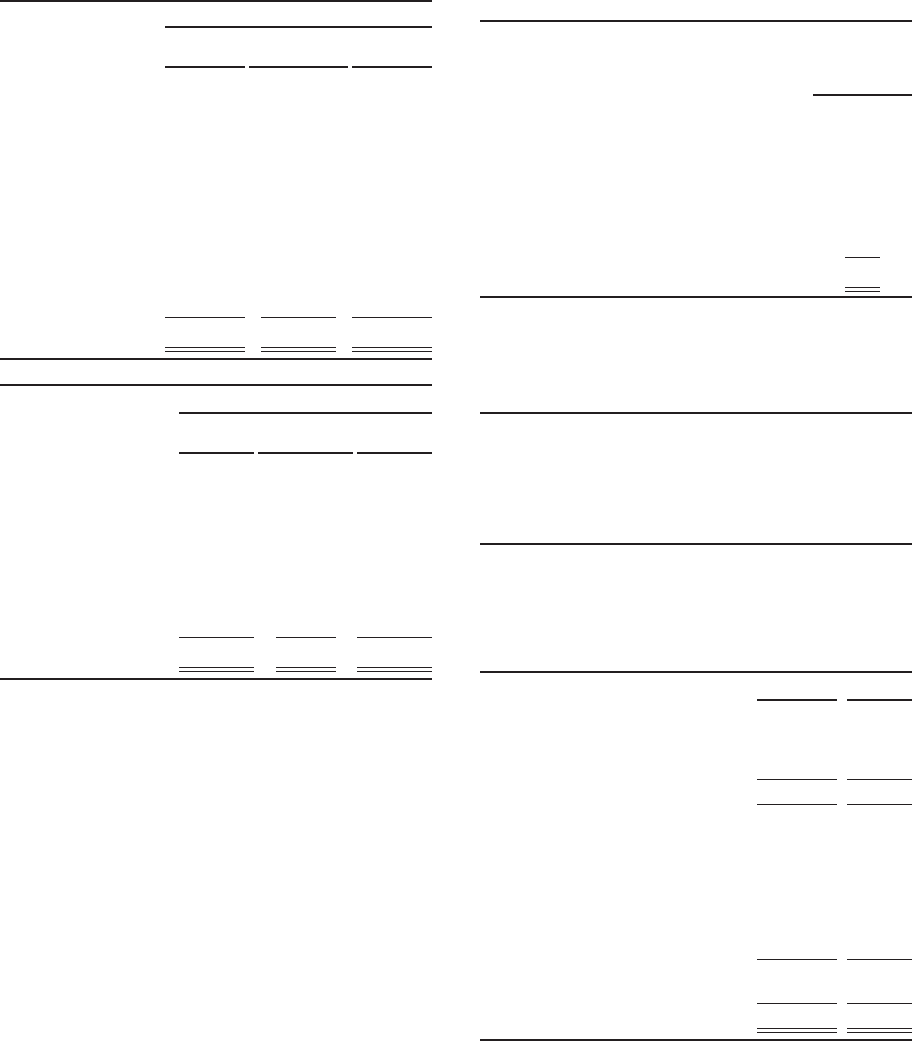
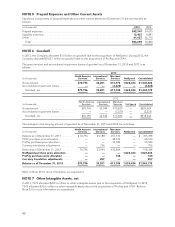
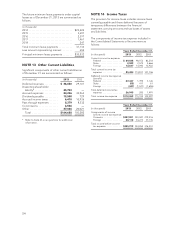
Significant components of other intangible assets as
of December 31 are summarized as follows:
2013
(in thousands) Gross Accumulated
Amortization Net
Channel
relationships ...$318,600 (20,261) $298,339
Customer
relationships ... 167,871 (69,114) 98,757
Trade name ...... 46,561 (6,527) 40,034
Database ........ 28,000 (2,800) 25,200
Covenants-not-to-
compete ....... 14,940 (2,887) 12,053
Trade
association ..... 10,000 (3,750) 6,250
Favorable lease .. 875 (89) 786
Total ............$586,847 (105,428) $481,419
2012
(in thousands) Gross Accumulated
Amortization Net
Customer
relationships .....$167,641 (49,822) $117,819
Trade association . . . 10,000 (2,750) 7,250
Trade name ........ 2,537 (1,504) 1,033
Channel
relationships ..... 1,600 (266) 1,334
Covenants-not-to-
compete ......... 3,440 (822) 2,618
Total ..............$185,218 (55,164) $130,054
Amortization related to other intangible assets, which
is recorded in selling, general and administrative
expenses, was $50.0 million, $16.6 million and
$13.2 million for 2013, 2012 and 2011, respectively.
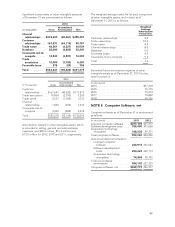
The weighted average useful life for each component
of other intangible assets, and in total, as of
December 31, 2013 is as follows:
Weighted
Average
Amortization
Period (Yrs)
Customer relationships ............. 8.2
Trade association .................. 10.0
Trade name ...................... 4.9
Channel relationships .............. 8.0
Database ........................ 5.0
Favorable Lease ................... 4.9
Covenants-not-to-compete ......... 5.3
Total ............................ 7.6
Estimated future amortization expense of other
intangible assets as of December 31, 2013 for the
next five years is:
(in thousands)
2014 ................................ $77,218
2015 ................................ 75,770
2016 ................................ 75,213
2017 ................................ 74,822
2018 ................................ 60,166
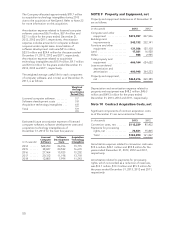
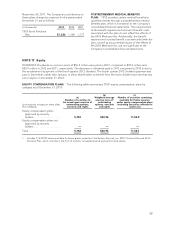
NOTE 8 Computer Software, net
Computer software as of December 31 is summarized
as follows:
(in thousands) 2013 2012
Licensed computer software .... $417,139 461,217
Software development costs .... 338,490 303,668
Acquisition technology
intangibles ................ 168,336 89,371
Total computer software ....... 923,965 854,256
Less accumulated amortization:
Licensed computer
software ................. 224,915 336,521
Software development
costs .................... 254,423 232,113
Acquisition technology
intangibles ............... 74,854 58,705
Total accumulated
amortization ............... 554,192 627,339
Computer software, net ........ $369,773 226,917
49