NetSpend 2013 Annual Report Download - page 70
Download and view the complete annual report
Please find page 70 of the 2013 NetSpend annual report below. You can navigate through the pages in the report by either clicking on the pages listed below, or by using the keyword search tool below to find specific information within the annual report.-
 1
1 -
2
-
3
-
4
-
5
-
6
-
7
-
8
-
9
-
10
-
11
-
12
-
13
-
14
-
15
-
16
-
17
-
18
-
19
-
20
-
21
-
22
-
23
-
24
-
25
-
26
-
27
-
28
-
29
-
30
-
31
-
32
-
33
-
34
-
35
-
36
-
37
-
38
-
39
-
40
-
41
-
42
-
43
-
44
-
45
-
46
-
47
-
48
-
49
-
50
-
51
-
52
-
53
-
54
-
55
-
56
-
57
-
58
-
59
-
 60
60 -
 61
61 -
 62
62 -
 63
63 -
 64
64 -
 65
65 -
 66
66 -
 67
67 -
 68
68 -
 69
69 -
 70
70 -
 71
71 -
 72
72 -
 73
73 -
 74
74 -
 75
75 -
 76
76 -
 77
77 -
 78
78 -
 79
79 -
 80
80 -
81
-
82
-
83
-
84
 |
 |

Years Ended December 31,
(in thousands)
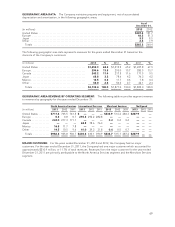
Operating Segments 2013 2012 2011
Revenues before reimbursable items
North America Services ........................................ $ 860,645 826,750 809,069
International Services .......................................... 389,532 396,149 380,129
Merchant Services ............................................ 446,277 409,698 373,159
NetSpend ................................................... 207,851 ——
Intersegment revenues ........................................ (12,550) (14,106) (21,659)
Revenues before reimbursable items from external customers ...... $ 1,891,755 1,618,491 1,540,698
Total revenues
North America Services ........................................ $ 1,000,072 965,393 954,550
International Services .......................................... 409,597 413,467 394,831
Merchant Services ............................................ 533,049 512,580 487,997
NetSpend ................................................... 207,851 ——
Intersegment revenues ........................................ (18,216) (20,468) (28,412)
Revenues from external customers ............................. $ 2,132,353 1,870,972 1,808,966
Depreciation and amortization
North America Services ........................................ $ 74,479 74,673 77,446
International Services .......................................... 47,978 55,033 49,722
Merchant Services ............................................ 12,034 12,083 15,416
NetSpend ................................................... 3,121 ——
Segment depreciation and amortization .......................... 137,612 141,789 142,584
Acquisition intangible amortization .............................. 65,893 26,264 23,583
Corporate Administration and Other ............................. 1,846 2,557 2,998
Total depreciation and amortization ............................ $ 205,351 170,610 169,165
Adjusted segment operating income
North America Services ........................................ $ 314,577 289,493 254,552
International Services .......................................... 45,911 29,427 43,574
Merchant Services ............................................ 154,047 156,283 133,695
NetSpend ................................................... 59,717 ——
Total adjusted segment operating income ........................ 574,252 475,203 431,821
Acquisition intangible amortization .............................. (65,893) (26,264) (23,583)
NetSpend merger and acquisition operating expenses
(non-recurring) ............................................. (14,220) ——
Corporate Administration and Other ............................. (107,892) (91,287) (85,782)
Operating income .......................................... $ 386,247 357,652 322,456
As of December 31, 2013 2012
Total assets
North America Services ........................................ $ 3,240,298 1,744,877
International Services .......................................... 417,379 445,642
Merchant Services ............................................ 676,592 703,725
NetSpend ................................................... 1,596,150 —
Intersegment assets ........................................... (2,243,851) (870,406)
Total assets ................................................ $ 3,686,568 2,023,838
68