NetSpend 2013 Annual Report Download - page 21
Download and view the complete annual report
Please find page 21 of the 2013 NetSpend annual report below. You can navigate through the pages in the report by either clicking on the pages listed below, or by using the keyword search tool below to find specific information within the annual report.-
 1
1 -
2
-
3
-
4
-
5
-
6
-
7
-
8
-
9
-
10
-
 11
11 -
 12
12 -
 13
13 -
 14
14 -
 15
15 -
 16
16 -
 17
17 -
 18
18 -
 19
19 -
 20
20 -
 21
21 -
 22
22 -
 23
23 -
 24
24 -
 25
25 -
 26
26 -
 27
27 -
 28
28 -
 29
29 -
 30
30 -
 31
31 -
32
-
33
-
34
-
35
-
36
-
37
-
38
-
39
-
40
-
41
-
42
-
43
-
44
-
45
-
46
-
47
-
48
-
49
-
50
-
51
-
52
-
53
-
54
-
55
-
56
-
57
-
58
-
59
-
60
-
61
-
62
-
63
-
64
-
65
-
66
-
67
-
68
-
69
-
70
-
71
-
72
-
73
-
74
-
75
-
76
-
77
-
78
-
79
-
80
-
81
-
82
-
83
-
84
 |
 |

Movements in foreign currency exchange rates as
compared to the U.S. dollar can result in foreign
denominated financial statements being translated
into more or fewer U.S. dollars, which impact the
comparison to prior periods when the U.S. dollar was
stronger or weaker.
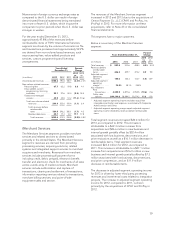
For the year ended December 31, 2013,
approximately 47.8% of the revenues before
reimbursable items of TSYS’ International Services
segment are driven by the volume of accounts on file
and transactions processed and approximately 52.2%
are derived from non-volume based revenues, such
as processing fees, value-added products and
services, custom programming and licensing
arrangements.
Years Ended
December 31, Percent
Change
(in millions) 2013 2012 2011
2013
vs.
2012
2012
vs.
2011
Volume-based revenues ..... $186.2 190.6 186.7 (2.3)% 2.2%
Non-volume related revenues:
Processing fees .......... 67.7 62.2 59.8 8.8 4.1
Value-added, custom
programming, licensing
and other ............. 95.1 97.6 82.4 (2.5) 18.5
Output and managed
services ............... 40.5 45.8 51.2 (11.6) (10.6)
Total non-volume related
revenues ............ 203.3 205.6 193.4 (1.1) 6.4
Total revenues before
reimbursable
items ............. 389.5 396.2 380.1 (1.7) 4.3
Reimbursable items . . . 20.1 17.3 14.7 17.1 17.8
Total revenues ..... $409.6 413.5 394.8 (0.9)% 4.8%
Merchant Services
The Merchant Services segment provides merchant
services and related services to clients based
primarily in the United States. The Merchant Services
segment’s revenues are derived from providing
processing services, acquiring solutions, related
systems and integrated support services to merchant
acquirers and merchants. Revenues from merchant
services include processing all payment forms
including credit, debit, prepaid, electronic benefit
transfer and electronic check for merchants of all sizes
across a wide array of market verticals. Merchant
services include authorization and capture of
transactions; clearing and settlement of transactions;
information reporting services related to transactions;
merchant billing services; and point-of-sale
equipment sales and service.
The revenues of the Merchant Services segment
increased in 2012 and 2013 due to the acquisitions of
Central Payment Co., LLC (CPAY) and ProPay, Inc.
(ProPay) in 2012. For more information on these
acquisitions, refer to Note 23 in the consolidated
financial statements.
This segment has no major customers.
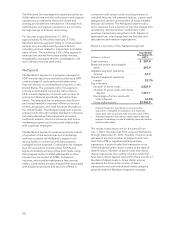
Below is a summary of the Merchant Services
segment:
Years Ended December 31, Percent
Change
(in millions) 2013 2012 2011
2013
vs.
2012
2012
vs.
2011
Total revenues .... $ 533.0 512.6 488.0 4.0% 5.0%
Revenues before
reimbursable
items .......... 446.3 409.7 373.2 8.9 9.8
Adjusted segment
operating
income1....... 154.0 156.3 133.7 (1.5) 16.9
Adjusted segment
operating
margin2........ 34.5% 38.1% 35.8%
Key indicators:
POS
transactions . . 4,359.8 4,877.6 4,955.5 (10.6) (1.6)
Dollar sales
volume ...... $44,144.0 38,994.0 33,674.2 13.2 15.8
1Adjusted segment operating income excludes acquisition
intangible amortization and expenses associated with Corporate
Administration and Other.
2Adjusted segment operating margin equals adjusted segment
operating income divided by revenues before reimbursable
items.
Total segment revenues increased $20.4 million for
2013, as compared to 2012. This increase is
attributable to a $62.3 million increase from
acquisitions and $26.6 million in new business and
internal growth partially offset by $52.4 million
associated with lost business, deconversions, and
price reductions as well as a $16.1 million decrease in
reimbursable items. Total segment revenues
increased $24.6 million for 2012, as compared to
2011. This increase is attributable to a $27.1 million
increase from acquisitions and $16.9 million in new
business and internal growth partially offset by $7.3
million associated with lost business, deconversions,
and price compression, and an $11.9 million
decrease in reimbursable items.
The decrease in adjusted segment operating income
for 2013 is driven by lower third party processing
revenues and incremental costs related to integration
projects. The increase in adjusted segment operating
income for 2012, compared to 2011, is driven
primarily by the acquisitions of CPAY and ProPay in
2012.
19