NetSpend 2013 Annual Report Download - page 25
Download and view the complete annual report
Please find page 25 of the 2013 NetSpend annual report below. You can navigate through the pages in the report by either clicking on the pages listed below, or by using the keyword search tool below to find specific information within the annual report.-
 1
1 -
2
-
3
-
4
-
5
-
6
-
7
-
8
-
9
-
10
-
11
-
12
-
13
-
14
-
 15
15 -
 16
16 -
 17
17 -
 18
18 -
 19
19 -
 20
20 -
 21
21 -
 22
22 -
 23
23 -
 24
24 -
 25
25 -
 26
26 -
 27
27 -
 28
28 -
 29
29 -
 30
30 -
 31
31 -
 32
32 -
 33
33 -
 34
34 -
 35
35 -
36
-
37
-
38
-
39
-
40
-
41
-
42
-
43
-
44
-
45
-
46
-
47
-
48
-
49
-
50
-
51
-
52
-
53
-
54
-
55
-
56
-
57
-
58
-
59
-
60
-
61
-
62
-
63
-
64
-
65
-
66
-
67
-
68
-
69
-
70
-
71
-
72
-
73
-
74
-
75
-
76
-
77
-
78
-
79
-
80
-
81
-
82
-
83
-
84
 |
 |

Although not a substitute for GAAP, TSYS believes
that non-GAAP financial measures are important to
enable investors to understand and evaluate its
ongoing operating results. Accordingly, TSYS
includes non-GAAP financial measures when
reporting its financial results to shareholders and
investors in order to provide them with an additional
tool to evaluate TSYS’ ongoing business operations.
TSYS believes that the non-GAAP financial measures
are representative of comparative financial
performance that reflects the economic substance of
TSYS’ current and ongoing business operations.
Although non-GAAP financial measures are often
used to measure TSYS’ operating results and assess
its financial performance, they are not necessarily
comparable to similarly titled captions of other
companies due to potential inconsistencies in the
method of calculation.
TSYS believes that its use of non-GAAP financial
measures provides investors with the same key
financial performance indicators that are utilized by
management to assess TSYS’ operating results,
evaluate the business and make operational decisions
on a prospective, going-forward basis. Hence,
management provides disclosure of non-GAAP
financial measures to give shareholders and potential
investors an opportunity to see TSYS as viewed by
management, to assess TSYS with some of the same
tools that management utilizes internally and to be
able to compare such information with prior periods.
TSYS believes that the presentation of GAAP financial
measures alone would not provide its shareholders
and potential investors with the ability to
appropriately analyze its ongoing operational results,
and therefore expected future results. TSYS therefore
believes that inclusion of non-GAAP financial
measures provides investors with additional
information to help them better understand its
financial statements just as management utilizes these
non-GAAP financial measures to better understand
the business, manage budgets and allocate resources.
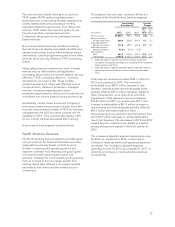
The following tables provide a reconciliation of GAAP
to non-GAAP financial measures:
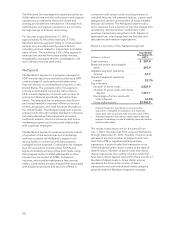
Adjusted EBITDA
Years Ended December 31,
(in thousands) 2013 2012 2011
Net income ................... $256,597 249,923 222,662
Adjusted for:
Equity in income of equity
investments, net of taxes ..... (13,047) (10,171) (8,708)
Income taxes ................ 112,369 115,102 102,597
Nonoperating expenses, net . . . 30,328 2,798 5,905
Depreciation and
amortization ............... 205,351 170,610 169,165
EBITDA ...................... 591,598 528,262 491,621
Adjusted For:
Share-based compensation .... 28,933 18,621 16,477
NetSpend merger and
acquisition expenses* ....... 13,634 ——
Adjusted EBITDA .............. $634,165 546,883 508,098
* Excludes share-based compensation
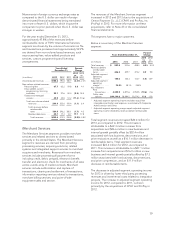
Adjusted Cash Earnings Per Share
Years Ended
December 31,
(in thousands except per share data) 2013 2012 2011
Net income attributable to TSYS
common shareholders
As reported (GAAP) ................ $244,750 244,280 220,559
Adjust for amounts attributable to
TSYS common shareholders (net of
taxes):
Acquisition intangible
amortization .................. 43,759 17,282 16,124
Share-based compensation ........ 19,838 12,683 11,265
Cash earnings ..................... 308,347 274,245 247,948
NetSpend merger and acquisition
expenses ..................... 15,251 ——
Adjusted cash earnings ............. $323,598 274,245 247,948
Basic EPS—Net income attributable
to TSYS common shareholders
As reported (GAAP) ................ $ 1.30 1.30 1.15
Adjust for amounts attributable to
TSYS common shareholders (net of
taxes):
Acquisition intangible
amortization .................. 0.23 0.09 0.08
Share-based compensation ........ 0.11 0.07 0.06
Cash earnings per share ............ 1.64 1.46 1.29
NetSpend merger and acquisition
expenses ..................... 0.08 ——
Adjusted cash earnings per share* .... $ 1.72 1.46 1.29
Average common shares and
participating securities ............ 188,391 188,030 191,946
* Adjusted cash EPS amounts do not total due to rounding.
23