NetSpend 2013 Annual Report Download - page 23
Download and view the complete annual report
Please find page 23 of the 2013 NetSpend annual report below. You can navigate through the pages in the report by either clicking on the pages listed below, or by using the keyword search tool below to find specific information within the annual report.-
 1
1 -
2
-
3
-
4
-
5
-
6
-
7
-
8
-
9
-
10
-
11
-
12
-
 13
13 -
 14
14 -
 15
15 -
 16
16 -
 17
17 -
 18
18 -
 19
19 -
 20
20 -
 21
21 -
 22
22 -
 23
23 -
 24
24 -
 25
25 -
 26
26 -
 27
27 -
 28
28 -
 29
29 -
 30
30 -
 31
31 -
 32
32 -
 33
33 -
34
-
35
-
36
-
37
-
38
-
39
-
40
-
41
-
42
-
43
-
44
-
45
-
46
-
47
-
48
-
49
-
50
-
51
-
52
-
53
-
54
-
55
-
56
-
57
-
58
-
59
-
60
-
61
-
62
-
63
-
64
-
65
-
66
-
67
-
68
-
69
-
70
-
71
-
72
-
73
-
74
-
75
-
76
-
77
-
78
-
79
-
80
-
81
-
82
-
83
-
84
 |
 |
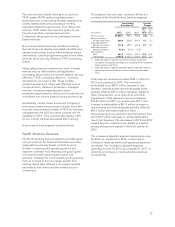
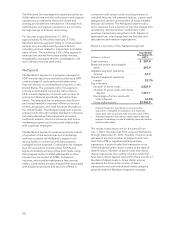
NetSpend segment revenues total $207.9 million
with 74.9% of revenues derived from fees charged to
cardholders and 25.1% of revenues derived from
interchange. Service fee revenues are driven by the
number of active cards which totaled approximately
2.8 million as of December 31, 2013, and in particular
by the number of cards with direct deposit.
Cardholders with direct deposit generally initiate
more transactions and generate more revenues than
those that do not take advantage of this feature.
Interchange revenues are driven by gross dollar
volume, which totaled approximately $7.7 billion for
the period ended December 31, 2013. Substantially
all of the NetSpend segment revenues are volume
driven as they are driven by the active card and gross
dollar volume indicators.
Cardholder funds and deposits related to NetSpend’s
prepaid products are held at FDIC-insured Issuing
Banks for the benefit of the cardholders. NetSpend
currently has active agreements with seven Issuing
Banks.
NetSpend’s prepaid card business derived
approximately one-third of its revenues from
cardholders acquired through one of its third-party
distributors.
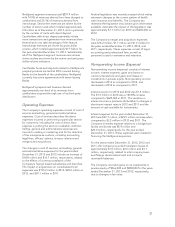
Operating Expenses
The Company’s operating expenses consist of cost of
services and selling, general and administrative
expenses. Cost of services describes the direct
expenses incurred in performing a particular service
for customers, including the cost of direct labor
expense in putting the service in saleable condition.
Selling, general and administrative expenses are
incurred in selling or marketing and for the direction
of the enterprise as a whole, including accounting,
legal fees, officers’ salaries, investor relations and
mergers and acquisitions.
The changes in cost of services, and selling, general
and administrative expenses for the years ended
December 31, 2013 and 2012 include an increase of
$18.8 million and $10.7 million, respectively, related
to the effects of currency translation of the
Company’s foreign based subsidiaries and branches.
The impact of acquisitions on consolidated total
expenses was $155.2 million in 2013, $20.0 million in
2012, and $39.1 million in 2011.
Federal legislation was recently enacted which makes
extensive changes to the current system of health
care insurance and benefits. The Company has
reviewed the legislation and, based upon information
available, estimates the impact of the legislation was
approximately $1.1 million on 2013 and $600,000 on
2012.
The Company’s merger and acquisition expenses
were $14.2 million, $1.7 million and $1.3 million for
the years ended December 31, 2013, 2012, and
2011, respectively. These expenses consist of legal,
accounting and professional fees, as well as
personnel costs for severance and retention.
Nonoperating Income (Expense)
Nonoperating income (expense) consists of interest
income, interest expense, gains and losses on
currency translations and gains and losses on
investments in private equity. Nonoperating income
decreased in 2013 as compared to 2012, and
decreased in 2012 as compared to 2011.
Interest income for 2013 and 2012 was $1.5 million.
The $1.5 million in 2012 was a 140.8% increase
compared to $620,000 in 2011. The variation in
interest income is primarily attributable to changes in
short-term interest rates in 2012 and 2011 and the
amount of cash available for investments.
Interest expense for the year ended December 31,
2013 was $32.7 million, a $29.5 million increase when
compared to $3.2 million in 2012 and 2011. The
Company’s interest expense related to a bridge loan
facility and bonds was $5.9 million and
$20.0 million, respectively, for the year ended
December 31, 2013. These expenses were related to
financing the NetSpend acquisition.
For the years ended December 31, 2013, 2012 and
2011, the Company recorded translation losses of
approximately $1.0 million, $2.0 million and $3.1
million, respectively, related to intercompany loans
and foreign denominated cash and accounts
receivable balances.
The Company recorded gains on its investments in
private equity of $966,000 and $898,000 for the years
ended December 31, 2013 and 2012, respectively,
due to changes in fair value.
21