NetSpend 2013 Annual Report Download - page 16
Download and view the complete annual report
Please find page 16 of the 2013 NetSpend annual report below. You can navigate through the pages in the report by either clicking on the pages listed below, or by using the keyword search tool below to find specific information within the annual report.-
 1
1 -
2
-
3
-
4
-
5
-
 6
6 -
 7
7 -
 8
8 -
 9
9 -
 10
10 -
 11
11 -
 12
12 -
 13
13 -
 14
14 -
 15
15 -
 16
16 -
 17
17 -
 18
18 -
 19
19 -
 20
20 -
 21
21 -
 22
22 -
 23
23 -
 24
24 -
 25
25 -
 26
26 -
27
-
28
-
29
-
30
-
31
-
32
-
33
-
34
-
35
-
36
-
37
-
38
-
39
-
40
-
41
-
42
-
43
-
44
-
45
-
46
-
47
-
48
-
49
-
50
-
51
-
52
-
53
-
54
-
55
-
56
-
57
-
58
-
59
-
60
-
61
-
62
-
63
-
64
-
65
-
66
-
67
-
68
-
69
-
70
-
71
-
72
-
73
-
74
-
75
-
76
-
77
-
78
-
79
-
80
-
81
-
82
-
83
-
84
 |
 |
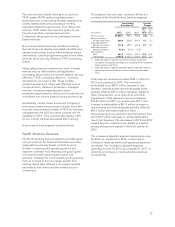
TSYS’ revenues are generated primarily from charges
based on the number of accounts on file (AOF),
transactions and authorizations processed,
statements mailed, cards embossed and mailed, and
other processing services for cardholder AOF.
Cardholder AOF include active and inactive
consumer credit, retail, prepaid, stored value,
government services and commercial card accounts.
TSYS’ revenues in its North America Services and
International Services segments are influenced by
several factors, including volumes related to AOF and
transactions. TSYS estimates that approximately
49.6% of these segments’ revenues is AOF and
transaction volume driven. The remaining 50.4% of
payment processing revenues are not AOF and
transaction volume driven, and are derived from
production and optional services TSYS considers to
be value added products and services, custom
programming and licensing arrangements.
Whether or not an account on file is active can impact
TSYS’ revenues differently. Active accounts are
accounts that have had monetary activity either
during the current month or in the past 90 days
based on contractual definition. Inactive accounts are
accounts that have not had a monetary transaction
(such as a purchase or payment) in the past 90 days.
The more active an account is, the more revenue is
generated for TSYS (items such as transactions and
authorizations processed and statements billed).
Occasionally, a client will purge inactive accounts
from its portfolio. An inactive account typically will
only generate an AOF charge. A processing client will
periodically review its cardholder portfolio based
upon activity and usage. Each client, based upon
criteria individually set by the client, will flag an
account to be “purged” from TSYS’ system and
deactivated.
A deconversion involves a client migrating all of its
accounts to an in-house solution or another
processor. Account deconversions include active and
inactive accounts and can impact the Company’s
revenues significantly more than an account purge.
A sale of a portfolio typically involves a client selling a
portion of its accounts to another party. A sale of a
portfolio and a deconversion impact the Company’s
financial statements in a similar fashion, although a
sale usually has a smaller financial impact due to the
number of accounts typically involved.
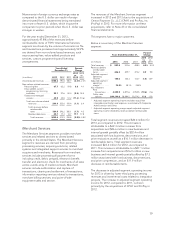
TSYS’ revenues in its Merchant Services segment are
influenced by several factors, including volumes
related to transactions and dollar sales volume, which
are approximately 93.4% of this segment’s revenues.
The remaining 6.6% of Merchant Services’ revenues
are derived from value added services, monthly
statement fees, compliance fees, and miscellaneous
services.
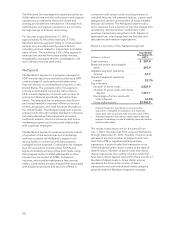
TSYS’ revenues in its NetSpend segment primarily
consist of a portion of the service fees and
interchange revenues received by NetSpend’s
prepaid card Issuing Banks in connection with the
programs managed by NetSpend. For the year
ended December 31, 2013, 74.9% of revenues was
derived from fees charged to cardholders and 25.1%
of revenues was derived from interchange. Service
fee revenues are driven by the number of active
cards, and in particular by the number of cards with
direct deposit. Cardholders with direct deposit
generally initiate more transactions and generate
more revenues than those that do not take
advantage of this feature. Interchange revenues are
driven by gross dollar volume. Substantially all of the
NetSpend segment’s revenues are volume driven as
they are driven by the active card and gross dollar
volume indicators.
14