NetSpend 2013 Annual Report Download - page 65
Download and view the complete annual report
Please find page 65 of the 2013 NetSpend annual report below. You can navigate through the pages in the report by either clicking on the pages listed below, or by using the keyword search tool below to find specific information within the annual report.-
 1
1 -
2
-
3
-
4
-
5
-
6
-
7
-
8
-
9
-
10
-
11
-
12
-
13
-
14
-
15
-
16
-
17
-
18
-
19
-
20
-
21
-
22
-
23
-
24
-
25
-
26
-
27
-
28
-
29
-
30
-
31
-
32
-
33
-
34
-
35
-
36
-
37
-
38
-
39
-
40
-
41
-
42
-
43
-
44
-
45
-
46
-
47
-
48
-
49
-
50
-
51
-
52
-
53
-
54
-
 55
55 -
 56
56 -
 57
57 -
 58
58 -
 59
59 -
 60
60 -
 61
61 -
 62
62 -
 63
63 -
 64
64 -
 65
65 -
 66
66 -
 67
67 -
 68
68 -
 69
69 -
 70
70 -
 71
71 -
 72
72 -
 73
73 -
 74
74 -
 75
75 -
76
-
77
-
78
-
79
-
80
-
81
-
82
-
83
-
84
 |
 |

vest, up to a maximum of 200% of the total grant.
Compensation expense for the award is measured on
the grant date based on the quoted market price of
TSYS common stock. The Company estimates the
probability of achieving the goals through the
performance period and will expense the award on a
straight-line basis. Compensation costs related to
these performance shares are expected to be
recognized until the end of 2014.
In March 2011, TSYS authorized a total grant of
263,292 performance shares to certain key executives
with a performance based vesting schedule (2011
performance shares). These 2011 performance shares
have a 2011-2013 performance period for which the
Compensation Committee of the Board of Directors
established two performance goals: compound
growth in revenues before reimbursable items and
income from continuing operations and, if such goals
are attained in 2013, the performance shares will
vest, up to a maximum of 200% of the total grant.
Compensation expense for the award is measured on
the grant date based on the quoted market price of
TSYS common stock. On January 22, 2014, when the
Committee certified performance, the performance
shares vested at approximately 153% of the total
grant.
As of December 31, 2013, there was approximately
$13.9 million of total unrecognized compensation
cost related to the 2012 and 2013 performance
shares compensation arrangement. That cost is
expected to be recognized until the end of 2015.
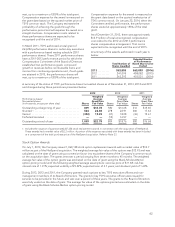
A summary of the awards authorized in each year is
below:
Total Number of
Shares Awarded
Potential Number
of Performance-
Based Shares to be
Vested
2013 ......... 563,803 563,803 (2016)
2012 ......... 241,095 458,082 (2015)
2011 ......... 263,292 403,521 (2014)
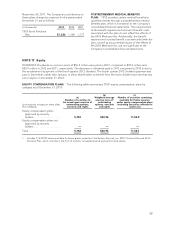
A summary of the status of TSYS’ performance-based nonvested shares as of December 31, 2013, 2012 and 2011
and changes during those periods are presented below:
2013 2012 2011
Performance-based
Nonvested shares
(in thousands, except per share data) Shares
Weighted
Average
Grant Date
Fair Value Shares
Weighted
Average
Grant Date
Fair Value Shares
Weighted
Average
Grant Date
Fair Value
Outstanding at beginning of year ............. 809 $18.76 580 $16.68 316 $15.65
Granted 1................................. 564 24.88 278 22.91 300 17.63
Vested ................................... (324) 15.93 (37) 18.08 (36) 15.61
Forfeited/canceled ......................... ——(12) 16.57 — —
Outstanding at end of year .................. 1,049 $22.75 809 $18.76 580 $16.68
1 Includes the issuance of approximately 87,356 stock replacement awards in connection with the acquisition of NetSpend.
These awards had a market value of $2.2 million. A portion of the expense associated with these awards has been included
as a component of the total purchase price of the NetSpend acquisition. Refer to Note 23.
Stock Option Awards
On July 1, 2013, the Company issued 1,060,148 stock option replacement awards with a market value of $13.7
million as part of the NetSpend acquisition. The weighted average fair value of the options was $12.93 and was
calculated on the date of grant using a conversion factor into equivalent shares of the Company’s common stock
on the acquisition date. The grants vest over a period ranging from seven months to 45 months. The weighted
average fair value of the option grants was estimated on the date of grant using the Black-Scholes-Merton
option-pricing model with the following weighted average assumptions: exercise price of $11.68; risk-free
interest rate of 1.31%; expected volatility of 29.22%; expected term of 4.7 years; and dividend yield of 1.63%.
During 2013, 2012 and 2011, the Company granted stock options to key TSYS executive officers and non-
management members of its Board of Directors. The grants to key TSYS executive officers were issued for
services to be provided in the future and vest over a period of three years. The grants to the Board of Directors
were fully vested on the date of grant. The average fair value of the options granted was estimated on the date
of grant using the Black-Scholes-Merton option-pricing model.
63