NetSpend 2013 Annual Report Download - page 66
Download and view the complete annual report
Please find page 66 of the 2013 NetSpend annual report below. You can navigate through the pages in the report by either clicking on the pages listed below, or by using the keyword search tool below to find specific information within the annual report.-
 1
1 -
2
-
3
-
4
-
5
-
6
-
7
-
8
-
9
-
10
-
11
-
12
-
13
-
14
-
15
-
16
-
17
-
18
-
19
-
20
-
21
-
22
-
23
-
24
-
25
-
26
-
27
-
28
-
29
-
30
-
31
-
32
-
33
-
34
-
35
-
36
-
37
-
38
-
39
-
40
-
41
-
42
-
43
-
44
-
45
-
46
-
47
-
48
-
49
-
50
-
51
-
52
-
53
-
54
-
55
-
 56
56 -
 57
57 -
 58
58 -
 59
59 -
 60
60 -
 61
61 -
 62
62 -
 63
63 -
 64
64 -
 65
65 -
 66
66 -
 67
67 -
 68
68 -
 69
69 -
 70
70 -
 71
71 -
 72
72 -
 73
73 -
 74
74 -
 75
75 -
 76
76 -
77
-
78
-
79
-
80
-
81
-
82
-
83
-
84
 |
 |
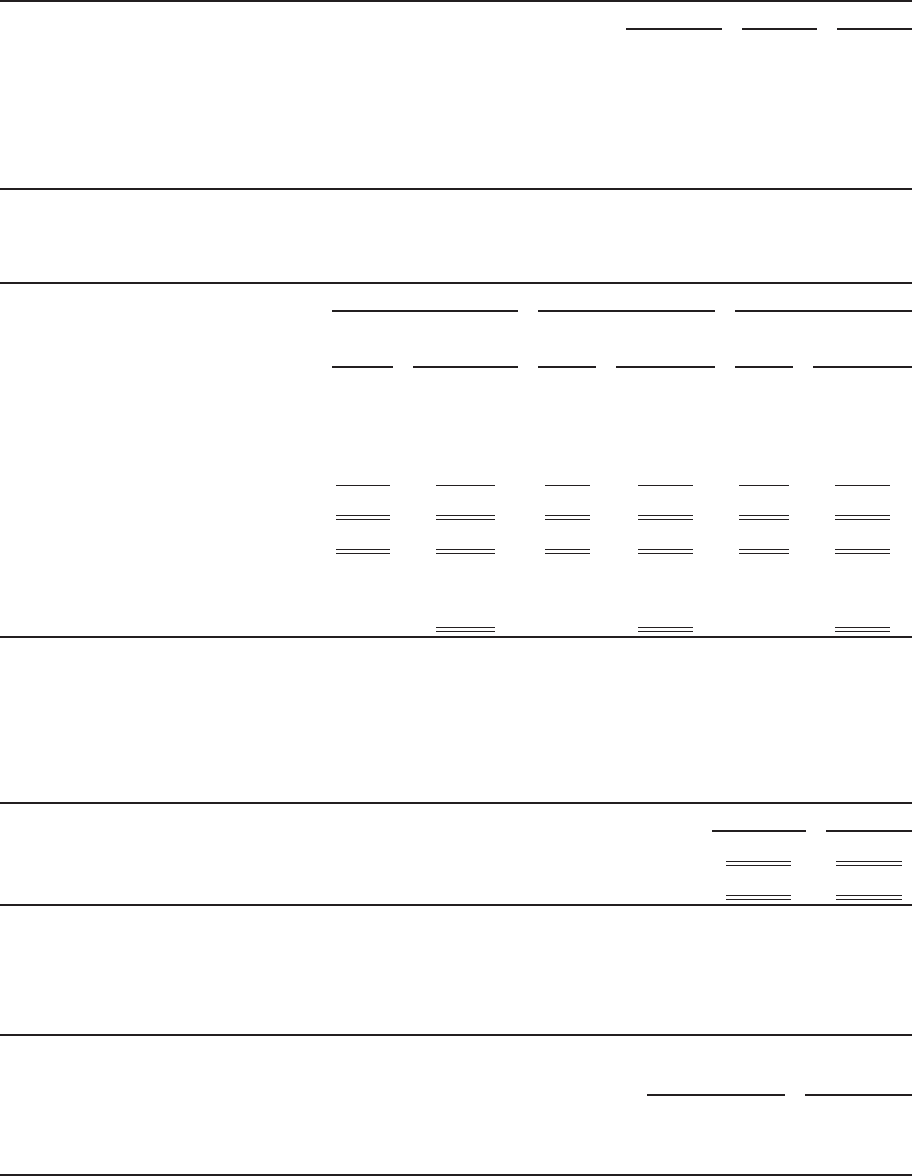
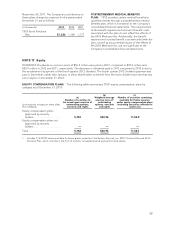
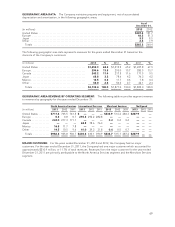
The following table summarizes the weighted average assumptions, and the weighted average fair value of the
options:
2013 2012 2011
Number of options granted ........................................ 1,939,796 818,090 716,508
Weighted average exercise price ................................... $ 17.42 $ 22.95 $ 17.61
Risk-free interest rate ............................................. 1.31% 1.69% 2.96%
Expected volatility ................................................ 26.81% 24.11% 29.98%
Expected term (years) ............................................. 6.0 7.9 8.5
Dividend yield ................................................... 1.64% 1.75% 1.59%
Weighted average fair value ........................................ $ 9.48 $ 5.27 $ 5.78
A summary of TSYS’ stock option activity as of December 31, 2013, 2012 and 2011, and changes during the years
ended on those dates is presented below:
2013 2012 2011
(in thousands,
except per share data) Options
Weighted
Average
Exercise Price Options
Weighted
Average
Exercise Price Options
Weighted
Average
Exercise Price
Options:
Outstanding at beginning of year . . 6,065 $21.27 6,082 $20.61 8,810 $23.40
Granted 1...................... 1,940 17.42 818 22.95 717 17.61
Exercised ...................... (2,177) 18.75 (619) 16.15 (597) 13.51
Forfeited/canceled .............. (76) 16.78 (216) 23.73 (2,848) 29.96
Outstanding at end of year ........ 5,752 $20.96 6,065 $21.27 6,082 $20.61
Options exercisable at year-end .... 3,232 $23.02 3,235 $24.12 3,122 $25.00
Weighted average fair value of
options granted during the
year ......................... $ 9.48 $ 5.27 $ 5.78
1 Includes the issuance of approximately 1.1 million stock option replacement awards in connection with the acquisition of
NetSpend. These awards had a market value of $13.7 million. A portion of the expense associated with these awards has
been included as a component of the total purchase price of the NetSpend acquisition. Refer to Note 23.
As of December 31, 2013, the average remaining contractual life and intrinsic value of TSYS’ outstanding and
exercisable stock options were as follows:
Outstanding Exercisable
Average remaining contractual life (in years) ................................... 6.5 4.5
Aggregate intrinsic value (in thousands) ....................................... $70,851 $33,143
Shares Issued for Options Exercised
During 2013, 2012 and 2011, employees of the Company exercised options for shares of TSYS common stock
that were issued from treasury. The table below summarizes these stock option exercises by year:
(in thousands)
Options Exercised
and Issued from
Treasury Intrinsic Value
2013 ............................................................. 2,177 $16,580
2012 ............................................................. 619 4,243
2011 ............................................................. 597 3,627
64