NetSpend 2013 Annual Report Download - page 71
Download and view the complete annual report
Please find page 71 of the 2013 NetSpend annual report below. You can navigate through the pages in the report by either clicking on the pages listed below, or by using the keyword search tool below to find specific information within the annual report.-
 1
1 -
2
-
3
-
4
-
5
-
6
-
7
-
8
-
9
-
10
-
11
-
12
-
13
-
14
-
15
-
16
-
17
-
18
-
19
-
20
-
21
-
22
-
23
-
24
-
25
-
26
-
27
-
28
-
29
-
30
-
31
-
32
-
33
-
34
-
35
-
36
-
37
-
38
-
39
-
40
-
41
-
42
-
43
-
44
-
45
-
46
-
47
-
48
-
49
-
50
-
51
-
52
-
53
-
54
-
55
-
56
-
57
-
58
-
59
-
60
-
 61
61 -
 62
62 -
 63
63 -
 64
64 -
 65
65 -
 66
66 -
 67
67 -
 68
68 -
 69
69 -
 70
70 -
 71
71 -
 72
72 -
 73
73 -
 74
74 -
 75
75 -
 76
76 -
 77
77 -
 78
78 -
 79
79 -
 80
80 -
 81
81 -
82
-
83
-
84
 |
 |
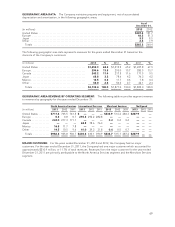
GEOGRAPHIC AREA DATA: The Company maintains property and equipment, net of accumulated
depreciation and amortization, in the following geographic areas:
As of
December 31,
(in millions) 2013 2012
United States ..................................................................... $207.4 191.7
Europe .......................................................................... 46.3 51.3
Japan ........................................................................... 5.3 9.5
Other ........................................................................... 6.2 7.9
Totals ......................................................................... $265.2 260.4
The following geographic area data represents revenues for the years ended December 31 based on the
domicile of the Company’s customers:
(in millions) 2013 % 2012 %2011 %
United States .................................. $1,453.3 68.2 $1,219.9 65.2 $1,227.8 67.9
Europe ........................................ 294.6 13.8 293.0 15.7 283.5 15.7
Canada ....................................... 243.2 11.4 217.5 11.6 171.5 9.5
Japan ......................................... 68.8 3.2 78.6 4.2 76.3 4.2
Mexico ........................................ 16.5 0.8 11.7 0.6 7.8 0.4
Other ......................................... 56.0 2.6 50.3 2.7 42.1 2.3
Totals ....................................... $2,132.4 100.0 $1,871.0 100.0 $1,809.0 100.0
GEOGRAPHIC AREA REVENUE BY OPERATING SEGMENT: The following table reconciles segment revenue
to revenues by geography for the years ended December 31:
North America Services International Services Merchant Services NetSpend
(in millions) 2013 2012 2011 2013 2012 2011 2013 2012 2011 2013 2012 2011
United States ........ $711.4 705.5 741.5 $— ——$533.9 514.4 486.3 $207.9 —
Europe ............. 0.8 0.8 0.7 293.8 292.2 282.8 ——— ———
Canada ............. 243.0 217.3 171.1 ——— 0.2 0.2 0.4 ———
Japan .............. ———68.8 78.6 76.3 ——— ———
Mexico ............. 16.5 11.7 7.8 ——— ——— ———
Other .............. 14.5 10.5 9.6 41.0 39.3 31.8 0.6 0.5 0.7 ———
Totals ............ $986.2 945.8 930.7 $403.6 410.1 390.9 $534.7 515.1 487.4 $207.9 ——
MAJOR CUSTOMER: For the years ended December 31, 2013 and 2012, the Company had no major
customers. For the year ended December 31, 2011, the Company had one major customer which accounted for
approximately $210.9 million, or 11.7% of total revenues. Revenues from the major customer for the year ended
December 31, 2011 are primarily attributable to the North America Services segment and the Merchant Services
segment.
69