NetSpend 2013 Annual Report Download - page 20
Download and view the complete annual report
Please find page 20 of the 2013 NetSpend annual report below. You can navigate through the pages in the report by either clicking on the pages listed below, or by using the keyword search tool below to find specific information within the annual report.-
 1
1 -
2
-
3
-
4
-
5
-
6
-
7
-
8
-
9
-
 10
10 -
 11
11 -
 12
12 -
 13
13 -
 14
14 -
 15
15 -
 16
16 -
 17
17 -
 18
18 -
 19
19 -
 20
20 -
 21
21 -
 22
22 -
 23
23 -
 24
24 -
 25
25 -
 26
26 -
 27
27 -
 28
28 -
 29
29 -
 30
30 -
31
-
32
-
33
-
34
-
35
-
36
-
37
-
38
-
39
-
40
-
41
-
42
-
43
-
44
-
45
-
46
-
47
-
48
-
49
-
50
-
51
-
52
-
53
-
54
-
55
-
56
-
57
-
58
-
59
-
60
-
61
-
62
-
63
-
64
-
65
-
66
-
67
-
68
-
69
-
70
-
71
-
72
-
73
-
74
-
75
-
76
-
77
-
78
-
79
-
80
-
81
-
82
-
83
-
84
 |
 |

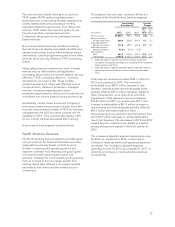
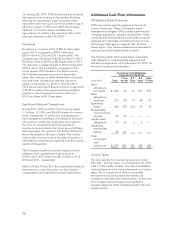
For the year ended December 31, 2013,
approximately 50.4% of revenues before
reimbursable items of TSYS’ North America Services
segment are driven by the volume of accounts on file
and transactions processed and approximately 49.6%
were derived from non-volume based revenues, such
as processing fees, value-added products and
services, custom programming and licensing
arrangements.
Years Ended
December 31, Percent
Change
(in millions) 2013 2012 2011
2013
vs.
2012
2012
vs.
2011
Volume-based revenues . . . $ 433.7 405.3 384.0 7.0% 5.5%
Non-volume related
revenues:
Processing fees ......... 195.4 183.1 184.4 6.7 (0.7)
Value-added, custom
programming, licensing
and other ............ 110.5 124.1 123.5 (11.0) 0.5
Output and managed
services ............. 121.1 114.3 117.2 5.9 (2.5)
Total non-volume
related revenues .... 427.0 421.5 425.1 1.3 (0.8)
Total revenues before
reimbursable
items ............ 860.7 826.8 809.1 4.1 2.2
Reimbursable
items ............ 139.4 138.6 145.5 0.7 (4.7)
Total revenues .... $1,000.1 965.4 954.6 3.6% 1.1%
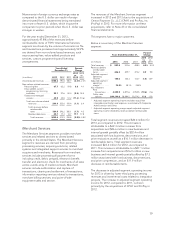
International Services
The International Services segment provides issuer
card solutions to financial institutions and other
organizations primarily based outside the North
America region. Growth in revenues and operating
profit in this segment is derived from retaining and
growing the core business and improving the overall
cost structure. Growing the core business comes
primarily from an increase in account usage, growth
from existing clients and sales to new clients and the
related account conversions.
This segment has one major customer.
Below is a summary of the International Services
segment:
Years Ended
December 31, Percent
Change
(in millions) 2013 2012 2011
2013
vs.
2012
2012
vs.
2011
Total revenues ........ $ 409.6 413.5 394.8 (0.9)% 4.7%
Revenues before
reimbursable items . . . 389.5 396.1 380.1 (1.7) 4.2
Adjusted segment
operating income1... 45.9 29.4 43.6 56.1 (32.6)
Adjusted segment
operating margin2... 11.8% 7.4% 11.5%
Key indicators:
AOF ............... 59.2 54.6 52.8 8.4 3.4
Transactions ........ 2,007.9 1,674.0 1,426.6 19.9 17.3
1 Adjusted segment operating income excludes acquisition
intangible amortization and expenses associated with Corporate
Administration and Other.
2 Adjusted segment operating margin equals adjusted segment
operating income divided by revenues before reimbursable
items.
Total segment revenues decreased $3.9 million for
2013, as compared to 2012. The decrease is mainly
attributable to $20.3 million foreign currency
translation, $18.9 million of lost business, and $9.7
million in termination fees, price reductions and other
adjustments, which is partially offset by an increase of
$42.3 million in new business and organic growth and
$2.7 million in reimbursable items. Total segment
revenues increased $18.7 million for 2012, as
compared to 2011. This increase is attributable to an
increase of $37.4 million in new business and organic
growth and a $2.6 million increase in reimbursable
items, which is partially offset by a decrease of $6.5
million related to the impact of foreign currency
translation, and $14.8 million of lost business.
The increases in adjusted segment operating income
for 2013, as compared to 2012, are driven primarily
from changes in foreign currency exchange rates and
decreases in employment expenses.
TSYS terminated its Japan Gift Card program in
February 2013 due to expected negative future cash
flows resulting from the loss of two of the Gift Card
program’s major customers. The program’s negative
future cash flows indicated that the carrying value of
its assets would not be recovered. As a result, a
provision for the program’s future losses was made
and its assets were written down to zero in 2012.
18