NetSpend 2013 Annual Report Download - page 78
Download and view the complete annual report
Please find page 78 of the 2013 NetSpend annual report below. You can navigate through the pages in the report by either clicking on the pages listed below, or by using the keyword search tool below to find specific information within the annual report.-
 1
1 -
2
-
3
-
4
-
5
-
6
-
7
-
8
-
9
-
10
-
11
-
12
-
13
-
14
-
15
-
16
-
17
-
18
-
19
-
20
-
21
-
22
-
23
-
24
-
25
-
26
-
27
-
28
-
29
-
30
-
31
-
32
-
33
-
34
-
35
-
36
-
37
-
38
-
39
-
40
-
41
-
42
-
43
-
44
-
45
-
46
-
47
-
48
-
49
-
50
-
51
-
52
-
53
-
54
-
55
-
56
-
57
-
58
-
59
-
60
-
61
-
62
-
63
-
64
-
65
-
66
-
67
-
 68
68 -
 69
69 -
 70
70 -
 71
71 -
 72
72 -
 73
73 -
 74
74 -
 75
75 -
 76
76 -
 77
77 -
 78
78 -
 79
79 -
 80
80 -
 81
81 -
 82
82 -
 83
83 -
 84
84
 |
 |

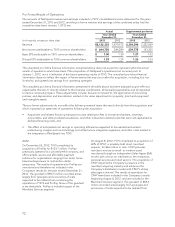
Pro forma Results of Operations
The pro forma revenue and earnings of TSYS’
acquisitions other than NetSpend are not material to
the consolidated financial statements.
NOTE 24 Collaborative Arrangement
TSYS has a 45% ownership interest in an enterprise
jointly owned with two other entities which operates
aircraft for the owners’ internal use. The arrangement
allows each entity access to the aircraft and each
entity pays for its usage of the aircraft. Each quarter,
the net operating results of the enterprise are shared
among the owners based on their respective
ownership percentage.
TSYS records its usage of the aircraft and its share of
net operating results of the enterprise in selling,
general and administrative expenses.
NOTE 25 Earnings Per Share
The following table illustrates basic and diluted EPS under the guidance of ASC 260:
December 31, 2013 December 31, 2012 December 31, 2011
(in thousands, except per share data)
Common
Stock Participating
Securities Common
Stock Participating
Securities Common
Stock Participating
Securities
Basic EPS:
Net income ................................ $244,750 244,280 220,559
Less income allocated to nonvested awards ..... (1,595) 1,595 (800) 800 (805) 805
Net income allocated to common stock for
EPS calculation(a) ....................... $243,155 1,595 243,480 800 219,754 805
Average common shares outstanding(b) ........ 187,145 1,246 187,403 627 191,239 707
Basic EPS(a)/(b) ............................ $ 1.30 1.28 1.30 1.28 1.15 1.14
Diluted EPS:
Net income ................................ $244,750 244,280 220,559
Less income allocated to nonvested awards ..... (1,585) 1,585 (796) 796 (804) 804
Net income allocated to common stock for
EPS calculation(c) ....................... $243,165 1,585 243,484 796 219,755 804
Average common shares outstanding .......... 187,145 1,246 187,403 627 191,239 707
Increase due to assumed issuance of shares
related to common equivalent shares
outstanding ............................. 1,648 1,262 345
Average common and common equivalent
shares outstanding(d) ..................... 188,793 1,246 188,665 627 191,584 707
Diluted EPS(c)/(d) ........................... $ 1.29 1.27 1.29 1.27 1.15 1.14
The diluted EPS calculation excludes stock options and nonvested awards that are convertible into 1.9 million,
2.9 million and 3.6 million common shares for the years ended December 31, 2013, 2012 and 2011, respectively,
because their inclusion would have been anti-dilutive.
NOTE 26 Subsequent Events
On February 11, 2014, with cash on hand, the
Company acquired an additional 15% equity interest
in CPAY from CPC Holding Company, LLC, a
California limited liability company. This purchase
reduced the remaining redeemable noncontrolling
interest in CPAY to 25% of its total outstanding
equity.
76