NetSpend 2013 Annual Report Download - page 57
Download and view the complete annual report
Please find page 57 of the 2013 NetSpend annual report below. You can navigate through the pages in the report by either clicking on the pages listed below, or by using the keyword search tool below to find specific information within the annual report.-
 1
1 -
2
-
3
-
4
-
5
-
6
-
7
-
8
-
9
-
10
-
11
-
12
-
13
-
14
-
15
-
16
-
17
-
18
-
19
-
20
-
21
-
22
-
23
-
24
-
25
-
26
-
27
-
28
-
29
-
30
-
31
-
32
-
33
-
34
-
35
-
36
-
37
-
38
-
39
-
40
-
41
-
42
-
43
-
44
-
45
-
46
-
 47
47 -
 48
48 -
 49
49 -
 50
50 -
 51
51 -
 52
52 -
 53
53 -
 54
54 -
 55
55 -
 56
56 -
 57
57 -
 58
58 -
 59
59 -
 60
60 -
 61
61 -
 62
62 -
 63
63 -
 64
64 -
 65
65 -
 66
66 -
 67
67 -
68
-
69
-
70
-
71
-
72
-
73
-
74
-
75
-
76
-
77
-
78
-
79
-
80
-
81
-
82
-
83
-
84
 |
 |

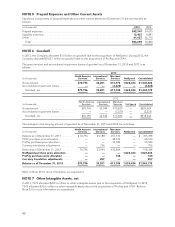
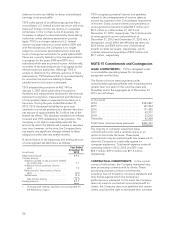
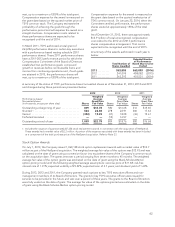
Income tax expense differed from the amounts
computed by applying the statutory U.S. federal
income tax rate of 35% to income before income
taxes, noncontrolling interest and equity in income of
equity investments as a result of the following:
Years Ended December 31,
(in thousands) 2013 2012 2011
Computed “expected”
income tax expense ...... $124,572 124,199 110,793
Increase (decrease) in income
tax expense resulting from:
International tax rate
differential ............ 3,228 2,781 1,831
State income tax expense,
net of federal income tax
effect ................. 3,495 2,143 3,164
Increase in valuation
allowance ............. 549 193 3,773
Tax credits .............. (6,148) (3,762) (9,044)
Deduction for domestic
production activities .... (8,225) (5,727) (5,524)
Permanent differences and
other, net ............. (5,102) (4,725) (2,396)
Total income tax expense . . . $112,369 115,102 102,597
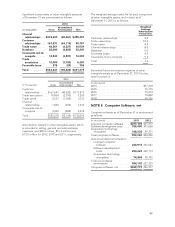
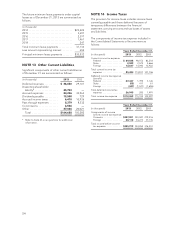
Temporary differences between the financial
statement carrying amounts and tax bases of assets
and liabilities that give rise to significant portions of
the net deferred tax liability as of December 31, 2013
and 2012 relate to the following:
(in thousands) 2013 2012
Deferred income tax assets:
Net operating loss and income tax
credit carryforwards .............$ 30,872 24,405
Allowances for doubtful accounts and
billing adjustments .............. 728 644
Deferred revenue ................. 20,111 18,645
Other, net ....................... 45,705 41,348
Total deferred income tax assets ...... 97,416 85,042
Less valuation allowance for deferred
income tax assets ............... (19,949) (19,400)
Net deferred income tax assets ....... 77,467 65,642
Deferred income tax liabilities:
Excess tax over financial statement
depreciation ................... (45,709) (36,682)
Computer software development
costs ......................... (55,074) (39,637)
Purchase accounting adjustments . . . (168,689) (4,514)
Foreign currency translation ........ (10,291) (8,574)
Other, net ....................... (5,821) (9,150)
Total deferred income tax
liabilities ...................... (285,584) (98,557)
Net deferred income tax liabilities . . . $(208,117) (32,915)
Total net deferred tax assets (liabilities):
Current .........................$ 14,770 9,825
Noncurrent ...................... (222,887) (42,740)
Net deferred income tax liability ......$(208,117) (32,915)
As of December 31, 2013, TSYS had recognized
deferred tax assets from net operating losses, capital
losses and federal and state income tax credit
carryforwards of $18.2 million, $1.9 million and
$10.8 million, respectively. As of December 31, 2012,
TSYS had recognized deferred tax assets from net
operating losses, capital losses and federal and state
income tax credit carry forwards of $13.4 million,
$1.9 million and $9.1 million, respectively. Some of
the net operating losses and some of the tax credits
began expiring in 2012.
In assessing the realizability of deferred income tax
assets, management considers whether it is more
likely than not that some portion or all of the deferred
income tax assets will not be realized. The ultimate
realization of deferred income tax assets is
dependent upon the generation of future taxable
income during the periods in which those temporary
differences become deductible. Management
considers the scheduled reversal of deferred tax
liabilities, projected future taxable income and tax
planning strategies in making this assessment.
Management believes it is more likely than not that
TSYS will realize the benefits of these deductible
differences, net of existing valuation allowances. The
valuation allowance for deferred tax assets was
$19.9 million and $19.4 million as of December 31,
2013 and 2012, respectively. The increase in the
valuation allowance for deferred income tax assets
was $0.5 million for 2013. The increase in the
valuation allowance for deferred income tax assets
was $0.2 million for 2012. The increase relates to
foreign losses and state tax credits which, more likely
than not, will not be realized in later years.
TSYS has adopted the permanent reinvestment
exception under ASC 740, “Income Taxes,” with
respect to future earnings of certain foreign
subsidiaries. As a result, TSYS considers foreign
earnings related to these foreign operations to be
permanently reinvested. No provision for U.S. federal
and state incomes taxes has been made in the
consolidated financial statements for those non-
U.S. subsidiaries whose earnings are considered to
be reinvested. The amount of undistributed earnings
considered to be “reinvested” which may be subject
to tax upon distribution was approximately
$79.0 million as of December 31, 2013. Although
TSYS does not intend to repatriate these earnings, a
distribution of these non-U.S. earnings in the form of
dividends, or otherwise, would subject the Company
to both U.S. federal and state income taxes, as
adjusted for non-U.S. tax credits, and withholding
taxes payable to the various non-U.S. countries.
Determination of the amount of any unrecognized
55