MoneyGram 2006 Annual Report Download - page 98
Download and view the complete annual report
Please find page 98 of the 2006 MoneyGram annual report below. You can navigate through the pages in the report by either clicking on the pages listed below, or by using the keyword search tool below to find specific information within the annual report.-
 1
1 -
2
-
3
-
4
-
5
-
6
-
7
-
8
-
9
-
10
-
11
-
12
-
13
-
14
-
15
-
16
-
17
-
18
-
19
-
20
-
21
-
22
-
23
-
24
-
25
-
26
-
27
-
28
-
29
-
30
-
31
-
32
-
33
-
34
-
35
-
36
-
37
-
38
-
39
-
40
-
41
-
42
-
43
-
44
-
45
-
46
-
47
-
48
-
49
-
50
-
51
-
52
-
53
-
54
-
55
-
56
-
57
-
58
-
59
-
60
-
61
-
62
-
63
-
64
-
65
-
66
-
67
-
68
-
69
-
70
-
71
-
72
-
73
-
74
-
75
-
76
-
77
-
78
-
79
-
80
-
81
-
82
-
83
-
84
-
85
-
86
-
87
-
 88
88 -
 89
89 -
 90
90 -
 91
91 -
 92
92 -
 93
93 -
 94
94 -
 95
95 -
 96
96 -
 97
97 -
 98
98 -
 99
99 -
 100
100 -
 101
101 -
 102
102 -
 103
103 -
 104
104 -
 105
105 -
 106
106 -
 107
107 -
 108
108
 |
 |

Table of Contents
MONEYGRAM INTERNATIONAL, INC. AND SUBSIDIARIES
NOTES TO CONSOLIDATED FINANCIAL STATEMENTS — (Continued)
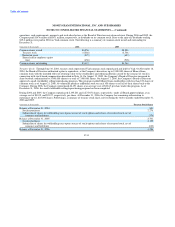
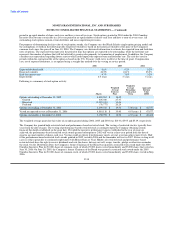
transfer transactions during the remainder of its contract. However, under the terms of certain agent contracts, the Company may
terminate the contract if the projected or actual volume of transactions falls beneath a contractually specified amount. In fiscal 2006 and
2005, the Company paid $3.0 million and $2.5 million respectively, under these guarantees, or approximately 40 percent and 50 percent
of the estimated maximum payment for the year, respectively.
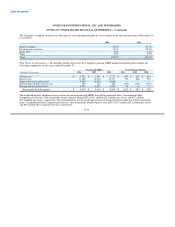
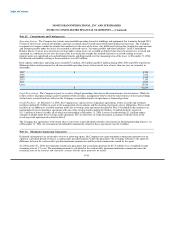
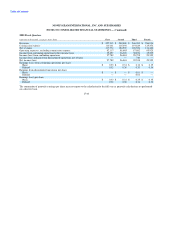
Note 17. Segment Information
Our business is conducted through two reportable segments: Global Funds Transfer and Payment Systems. The Global Funds Transfer
segment primarily provides money transfer services through a network of global retail agents and domestic money orders. In addition,
Global Funds Transfer provides a full line of bill payment services. The Payment Systems segment primarily provides official check
services for financial institutions in the United States, and processes controlled disbursements. In addition, Payment Systems sells money
orders through financial institutions in the United States. One agent in the Global Funds Transfer segment accounted for approximately
17 and 13 percent of total revenue in 2006 and 2005 respectively; no customer or agent in either segment accounted for more than
10 percent of total revenue in 2004.
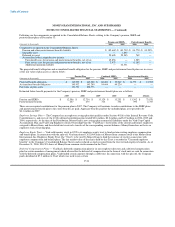
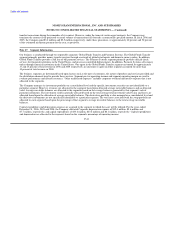
The business segments are determined based upon factors such as the type of customers, the nature of products and services provided and
the distribution channels used to provide those services. Segment pre-tax operating income and segment operating margin are used to
evaluate performance and allocate resources. "Other unallocated expenses" includes corporate overhead and interest expense that is not
allocated to the segments.
The Company manages its investment portfolio on a consolidated level and the specific investment securities are not identifiable to a
particular segment. However, revenues are allocated to the segments based upon allocated average investable balances and an allocated
yield. Average investable balances are allocated to the segments based on the average balances generated by that segment's sale of
payment instruments. The investment yield is generally allocated based on the total average total investment yield. Gains and losses are
allocated based upon the allocation of average investable balances. The derivatives portfolio is also managed on a consolidated level and
the derivative instruments are not specifically identifiable to a particular segment. The total costs associated with the swap portfolio are
allocated to each segment based upon the percentage of that segment's average investable balances to the total average investable
balances.
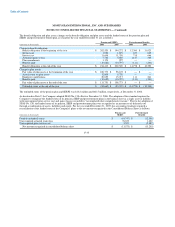
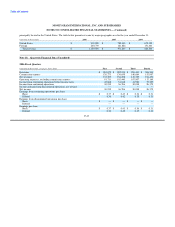
Capital expenditures and depreciation expense are assigned to the segment in which the asset will be utilized. For the years ended
December 31, 2006, 2005 and 2004, the Company allocated Corporate depreciation expense of $12.4 million, $9.6 million and
$7.7 million, respectively, and capital expenditures of $33.6 million, $23.6 million and $8.1 million, respectively. Capital expenditures
and depreciation are allocated to the segments based on the segment's percentage of operating income.
F-41