MoneyGram 2006 Annual Report Download - page 26
Download and view the complete annual report
Please find page 26 of the 2006 MoneyGram annual report below. You can navigate through the pages in the report by either clicking on the pages listed below, or by using the keyword search tool below to find specific information within the annual report.-
 1
1 -
2
-
3
-
4
-
5
-
6
-
7
-
8
-
9
-
10
-
11
-
12
-
13
-
14
-
15
-
 16
16 -
 17
17 -
 18
18 -
 19
19 -
 20
20 -
 21
21 -
 22
22 -
 23
23 -
 24
24 -
 25
25 -
 26
26 -
 27
27 -
 28
28 -
 29
29 -
 30
30 -
 31
31 -
 32
32 -
 33
33 -
 34
34 -
 35
35 -
 36
36 -
37
-
38
-
39
-
40
-
41
-
42
-
43
-
44
-
45
-
46
-
47
-
48
-
49
-
50
-
51
-
52
-
53
-
54
-
55
-
56
-
57
-
58
-
59
-
60
-
61
-
62
-
63
-
64
-
65
-
66
-
67
-
68
-
69
-
70
-
71
-
72
-
73
-
74
-
75
-
76
-
77
-
78
-
79
-
80
-
81
-
82
-
83
-
84
-
85
-
86
-
87
-
88
-
89
-
90
-
91
-
92
-
93
-
94
-
95
-
96
-
97
-
98
-
99
-
100
-
101
-
102
-
103
-
104
-
105
-
106
-
107
-
108
 |
 |

Table of Contents
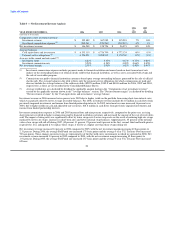
RESULTS OF OPERATIONS
Summary
Following are significant items affecting operating results from continuing operations in 2006:
• Global Funds Transfer segment revenue grew 26 percent in 2006, driven by 32 percent revenue growth in money transfer.
• Our money order transaction volume declined four percent in 2006 as expected, which is slightly less than the trend for paper-based
instruments. Based on current industry information, the trend in paper-based payment instruments is estimated to be an annual
decline of five to eight percent.
• The net investment margin of 2.31 percent (see Table 3) improved over the 2005 net investment margin of 1.91 percent primarily
due to higher yields on the portfolio related to higher short-term interest rates and a successful hedging strategy.
• Fee and other revenue increased 26 percent in 2006, primarily from growth in money transfer transaction volume.
• Marketing expenditures increased over 39 percent as we invest in our brand.
• Our effective tax rate of 29.8 percent increased in 2006 compared to 23.3 percent in 2005 primarily due to tax exempt investment
income declining as a percentage of total pre-tax income.
In 2006, we continued to realize strong transaction volume growth in our money transfer product (which includes our bill payment
services). Money order volumes and average investable balances declined as expected. The decline in money orders is consistent with the
overall decreasing use of paper-based instruments, while the decline in average investable balances is due to the consolidation of financial
institutions and a slowing of consumer mortgage transactions. In 2006, we operated in a flat yield curve environment, where short-term
and long-term interest rates were about the same. This is a challenging environment for our official check business as it puts pressure on
our net investment margin by holding investment yields down while investment commissions increase more quickly. Despite this
pressure, we realized growth in our net investment margin through a successful hedging strategy and adjusting pricing to reflect the
current interest rate environment as contracts renew. The credit quality of our investment portfolio continued to improve, as evidenced by
the cash recoveries on previously impaired investments and lower impairment charges taken in 2006.
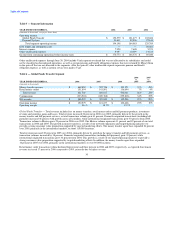
Components of Net Revenue
Our net revenue consists of fee and other revenue, investment revenue and net securities gains and losses, less commission expense. We
generate net revenue primarily by charging transaction fees in excess of third-party agent commissions, managing foreign currency
exchange and managing our investments to provide returns in excess of commissions paid to financial institution customers.
We derive revenue primarily through service fees charged to consumers and through our investments. Fee and other revenue consist of
transaction fees, foreign exchange and miscellaneous revenue. Transaction fees are fees earned on the sale of money transfers, retail
money order and bill payment products and official check transactions. Money transfer transaction fees are fixed per transaction and may
vary based upon the face value of the amount of the transaction and the location in which the money transfer originates and to which it is
sent. Money order and bill payment transaction fees are fixed per transaction. Foreign exchange revenue is derived from the management
of currency exchange spreads on international money transfer transactions. Miscellaneous revenue primarily consists of processing fees
on rebate checks and controlled disbursements, service charges on aged outstanding money orders and money order dispenser fees.
Investment revenue consists of interest and dividends generated through the investment of cash balances received from the sale of official
checks, money orders and other payment instruments. These cash balances are available to us for investment until the payment instrument
is presented for payment. Investment revenue varies depending on the level of investment balances and the yield on our investments.
Investment balances vary based on the number of payment instruments sold, the average face amount of those payment instruments and
the average length of time that passes until the instruments are presented for payment. Net securities gains and losses consist of realized
gains and losses on the sale of investments, as well as other-than-temporary impairments of investments.
23