MoneyGram 2006 Annual Report Download - page 100
Download and view the complete annual report
Please find page 100 of the 2006 MoneyGram annual report below. You can navigate through the pages in the report by either clicking on the pages listed below, or by using the keyword search tool below to find specific information within the annual report.-
 1
1 -
2
-
3
-
4
-
5
-
6
-
7
-
8
-
9
-
10
-
11
-
12
-
13
-
14
-
15
-
16
-
17
-
18
-
19
-
20
-
21
-
22
-
23
-
24
-
25
-
26
-
27
-
28
-
29
-
30
-
31
-
32
-
33
-
34
-
35
-
36
-
37
-
38
-
39
-
40
-
41
-
42
-
43
-
44
-
45
-
46
-
47
-
48
-
49
-
50
-
51
-
52
-
53
-
54
-
55
-
56
-
57
-
58
-
59
-
60
-
61
-
62
-
63
-
64
-
65
-
66
-
67
-
68
-
69
-
70
-
71
-
72
-
73
-
74
-
75
-
76
-
77
-
78
-
79
-
80
-
81
-
82
-
83
-
84
-
85
-
86
-
87
-
88
-
89
-
 90
90 -
 91
91 -
 92
92 -
 93
93 -
 94
94 -
 95
95 -
 96
96 -
 97
97 -
 98
98 -
 99
99 -
 100
100 -
 101
101 -
 102
102 -
 103
103 -
 104
104 -
 105
105 -
 106
106 -
 107
107 -
 108
108
 |
 |
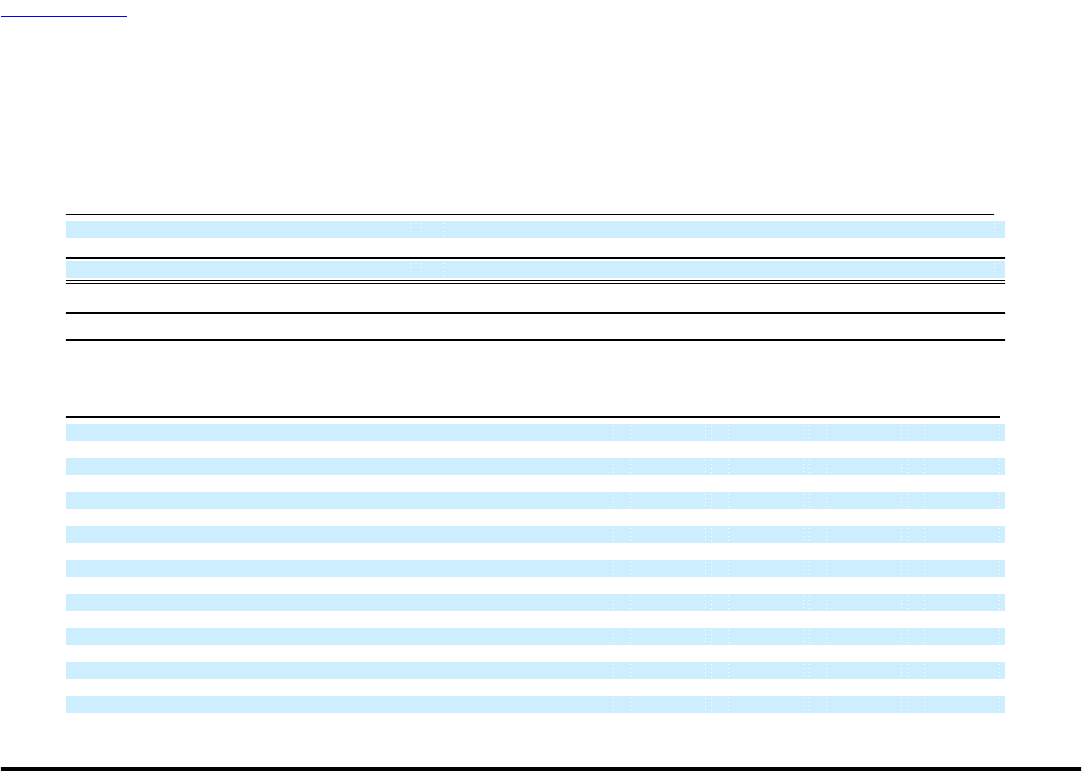
Table of Contents
MONEYGRAM INTERNATIONAL, INC. AND SUBSIDIARIES
NOTES TO CONSOLIDATED FINANCIAL STATEMENTS — (Continued)
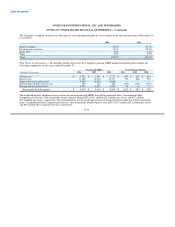
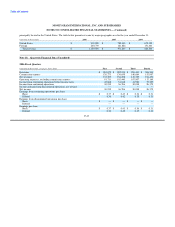
principally located in the United States. The table below presents revenue by major geographic area for the year ended December 31:
(Amounts in thousands) 2006 2005 2004
United States $ 918,820 $ 789,410 $ 675,129
Foreign 240,739 181,826 151,401
Total revenue $ 1,159,559 $ 971,236 $ 826,530
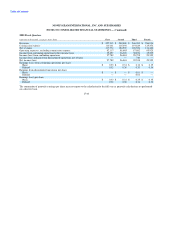
Note 18. Quarterly Financial Data (Unaudited)
2006 Fiscal Quarters
(Amounts in thousands, except per share data) First Second Third Fourth
Revenues $ 263,672 $ 292,913 $ 296,431 $ 306,543
Commission expense 126,273 138,655 146,664 152,067
Net revenues 137,399 154,258 149,767 154,476
Operating expenses, excluding commission expense 91,711 102,440 107,807 117,169
Income from continuing operations before income taxes 45,688 51,818 41,960 37,307
Income from continuing operations 30,935 36,706 30,038 26,375
Income and gain from discontinued operations, net of taxes — — — —
Net income 30,935 36,706 30,038 26,375
Earnings from continuing operations per share
Basic $ 0.37 $ 0.43 $ 0.36 $ 0.31
Diluted 0.36 0.42 0.35 0.31
Earnings from discontinued operations per share
Basic $ — $ — $ — $ —
Diluted — — — —
Earnings per share
Basic $ 0.37 $ 0.43 $ 0.36 $ 0.31
Diluted 0.36 0.42 0.35 0.31
F-43