MoneyGram 2006 Annual Report Download - page 29
Download and view the complete annual report
Please find page 29 of the 2006 MoneyGram annual report below. You can navigate through the pages in the report by either clicking on the pages listed below, or by using the keyword search tool below to find specific information within the annual report.-
 1
1 -
2
-
3
-
4
-
5
-
6
-
7
-
8
-
9
-
10
-
11
-
12
-
13
-
14
-
15
-
16
-
17
-
18
-
 19
19 -
 20
20 -
 21
21 -
 22
22 -
 23
23 -
 24
24 -
 25
25 -
 26
26 -
 27
27 -
 28
28 -
 29
29 -
 30
30 -
 31
31 -
 32
32 -
 33
33 -
 34
34 -
 35
35 -
 36
36 -
 37
37 -
 38
38 -
 39
39 -
40
-
41
-
42
-
43
-
44
-
45
-
46
-
47
-
48
-
49
-
50
-
51
-
52
-
53
-
54
-
55
-
56
-
57
-
58
-
59
-
60
-
61
-
62
-
63
-
64
-
65
-
66
-
67
-
68
-
69
-
70
-
71
-
72
-
73
-
74
-
75
-
76
-
77
-
78
-
79
-
80
-
81
-
82
-
83
-
84
-
85
-
86
-
87
-
88
-
89
-
90
-
91
-
92
-
93
-
94
-
95
-
96
-
97
-
98
-
99
-
100
-
101
-
102
-
103
-
104
-
105
-
106
-
107
-
108
 |
 |
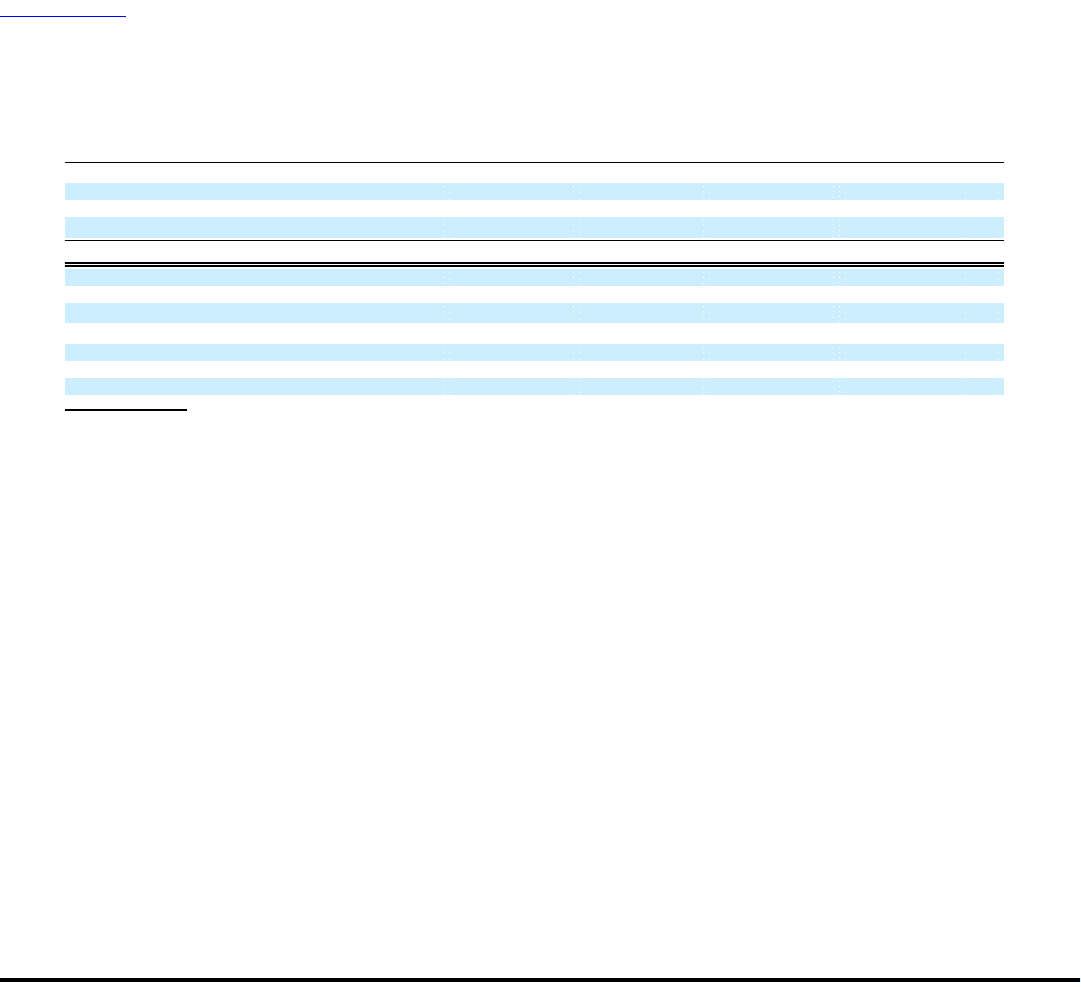
Table of Contents
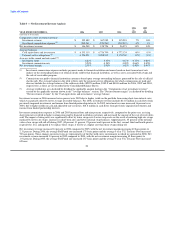
Table 3 — Net Investment Revenue Analysis
2006 2005
vs. vs.
YEAR ENDED DECEMBER 31, 2006 2005 2004 2005 2004
(Amounts in thousands)
Components of net investment revenue:
Investment revenue $ 395,489 $ 367,989 $ 315,983 7% 16%
Investment commissions expense (1) (249,241) (239,263) (219,912) 4% 9%
Net investment revenue $ 146,248 $ 128,726 $ 96,071 14% 34%
Average balances:
Cash equivalents and investments $ 6,333,115 $ 6,726,790 $ 6,772,124 (6%) (1%)
Payment service obligations (2) 4,796,538 5,268,512 5,370,768 (9%) (2%)
Average yields earned and rates paid (3):
Investment yield 6.24% 5.47% 4.67% 0.77% 0.80%
Investment commission rate 5.20% 4.54% 4.09% 0.66% 0.45%
Net investment margin 2.31% 1.91% 1.42% 0.40% 0.49%
(1) Investment commissions expense includes payments made to financial institution customers based on short-term interest rate
indices on the outstanding balances of official checks sold by that financial institution, as well as costs associated with swaps and
the sale of receivables program.
(2) Commissions are paid to financial institution customers based upon average outstanding balances generated by the sale of official
checks only. The average balance in the table reflects only the payment service obligations for which commissions are paid and
does not include the average balance of the sold receivables ($382.6 million, $389.8 and $404.6 million for 2006, 2005 and 2004,
respectively) as these are not recorded in the Consolidated Balance Sheets.
(3) Average yields/rates are calculated by dividing the applicable amount shown in the "Components of net investment revenue"
section by the applicable amount shown in the "Average balances" section. The "Net investment margin" is calculated by dividing
"Net investment revenue" by the "Cash equivalents and investments" average balance.
Investment revenue in 2006 increased seven percent over 2005 due to higher yields on the portfolio from rising short-term interest rates,
which was partially offset by lower average investable balances. For 2006, investment revenue includes $14.0 million in cash flows from
previously impaired investments and income from limited partnership interests. In 2005, investment revenue increased 16 percent over
2004, due to higher yields on cash and adjustable rate securities, $18.8 million in cash flows from previously impaired investments and
income from limited partnership interests.
Investment commissions expense in 2006 and 2005 increased four and nine percent, respectively, compared to the prior year, as rising
short-term rates resulted in higher commissions paid to financial institution customers and increased the amount of the cost of receivables
sold. The impact of rising rates was significantly offset by lower swap costs. Lower swap costs are the result of maturing high rate swaps
replaced by lower rate swaps, increases in short-term rates and lower notional swap balances. Approximately, 45 percent of the notional
value of our swaps will roll off during 2007 (40 percent, 31 percent, 25 percent and 4 percent in the first, second, third and fourth quarter,
respectively). It is anticipated if we replace these swaps, it will be at a higher cost than those swaps rolling off.
Net investment revenue increased 14 percent in 2006 compared to 2005, with the net investment margin increasing 40 basis points to
2.31 percent. During 2006, the average Fed Funds rate increased 175 basis points and the average 5-year U.S. Treasury Note increased
70 basis points. These changes in interest rates are representative of the flat yield curve environment in which we operated in 2006. Net
investment revenue increased 34 percent in 2005 compared to 2004, with the net investment margin increasing 49 basis points to
1.91 percent. During 2005, the average Fed Funds rate increased 187 basis points and the average 5-year U.S. Treasury Note increased
62 basis
26