MoneyGram 2006 Annual Report Download - page 77
Download and view the complete annual report
Please find page 77 of the 2006 MoneyGram annual report below. You can navigate through the pages in the report by either clicking on the pages listed below, or by using the keyword search tool below to find specific information within the annual report.-
 1
1 -
2
-
3
-
4
-
5
-
6
-
7
-
8
-
9
-
10
-
11
-
12
-
13
-
14
-
15
-
16
-
17
-
18
-
19
-
20
-
21
-
22
-
23
-
24
-
25
-
26
-
27
-
28
-
29
-
30
-
31
-
32
-
33
-
34
-
35
-
36
-
37
-
38
-
39
-
40
-
41
-
42
-
43
-
44
-
45
-
46
-
47
-
48
-
49
-
50
-
51
-
52
-
53
-
54
-
55
-
56
-
57
-
58
-
59
-
60
-
61
-
62
-
63
-
64
-
65
-
66
-
 67
67 -
 68
68 -
 69
69 -
 70
70 -
 71
71 -
 72
72 -
 73
73 -
 74
74 -
 75
75 -
 76
76 -
 77
77 -
 78
78 -
 79
79 -
 80
80 -
 81
81 -
 82
82 -
 83
83 -
 84
84 -
 85
85 -
 86
86 -
 87
87 -
88
-
89
-
90
-
91
-
92
-
93
-
94
-
95
-
96
-
97
-
98
-
99
-
100
-
101
-
102
-
103
-
104
-
105
-
106
-
107
-
108
 |
 |

Table of Contents
MONEYGRAM INTERNATIONAL, INC. AND SUBSIDIARIES
NOTES TO CONSOLIDATED FINANCIAL STATEMENTS — (Continued)
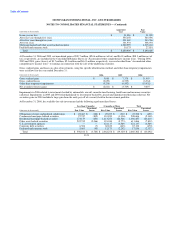
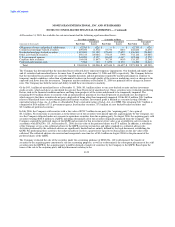
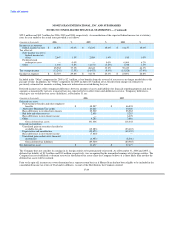
Statements of Income have therefore been restated. The results of operations of Game Financial, included in "Income and gain from
discontinued operations" include the following:
(Amounts in thousands) 2006 2005 2004
Revenue $ — $ — $ 10,668
Earnings before income taxes — — 852
Gain on disposition — 740 11,417
Income and gain from discontinued operations — 740 13,050
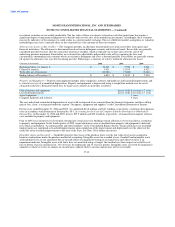
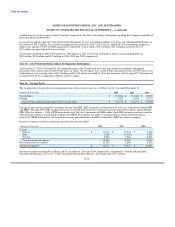
Note 4. Investments (Substantially Restricted)
The amortized cost and fair value of available-for-sale investments are as follows at December 31, 2006:
Gross Gross
Amortized Unrealized Unrealized Fair
(Amounts in thousands) Cost Gains Losses Value
Obligations of states and political subdivisions $ 765,525 $ 25,006 $ (490) $ 790,041
Commercial mortgage-backed securities 585,611 6,659 (2,148) 590,122
Residential mortgage-backed securities 1,623,220 3,876 (23,219) 1,603,877
Other asset-backed securities 1,992,164 36,920 (7,839) 2,021,245
U.S. government agencies 342,749 2,564 (6,589) 338,724
Corporate debt securities 311,465 7,745 (470) 318,740
Preferred and common stock 30,175 13 (2,337) 27,851
Total $ 5,650,909 $ 82,783 $ (43,092) $ 5,690,600
The amortized cost and fair value of available-for-sale investments are as follows at December 31, 2005:
Gross Gross
Amortized Unrealized Unrealized Fair
(Amounts in thousands) Cost Gains Losses Value
Obligations of states and political subdivisions $ 836,419 $ 35,610 $ (529) $ 871,500
Commercial mortgage-backed securities 691,604 10,297 (2,235) 699,666
Residential mortgage-backed securities 1,894,227 5,024 (20,800) 1,878,451
Other asset-backed securities 1,963,047 38,340 (10,885) 1,990,502
U.S. government agencies 360,236 5,641 (5,274) 360,603
Corporate debt securities 395,869 11,830 (2,266) 405,433
Preferred and common stock 30,175 217 (3,214) 27,178
Total $ 6,171,577 $ 106,959 $ (45,203) $ 6,233,333
At December 31, 2006 and 2005, no investments were classified as held-to-maturity. Trading investments have contractual maturities
ranging from the year 2029 to 2049, with auction dates typically 28 days after the date the Company purchases the security. The amortized
cost and market value of available-for-sale investments at December 31, 2006, by contractual maturity, are shown below. Actual maturities
may differ from contractual maturities as borrowers may have the right to call or prepay obligations, sometimes without call or prepayment
penalties. Maturities of mortgage-backed and other asset-backed securities depend on the repayment characteristics and experience of the
underlying obligations.
F-20