MoneyGram 2006 Annual Report Download - page 35
Download and view the complete annual report
Please find page 35 of the 2006 MoneyGram annual report below. You can navigate through the pages in the report by either clicking on the pages listed below, or by using the keyword search tool below to find specific information within the annual report.-
 1
1 -
2
-
3
-
4
-
5
-
6
-
7
-
8
-
9
-
10
-
11
-
12
-
13
-
14
-
15
-
16
-
17
-
18
-
19
-
20
-
21
-
22
-
23
-
24
-
 25
25 -
 26
26 -
 27
27 -
 28
28 -
 29
29 -
 30
30 -
 31
31 -
 32
32 -
 33
33 -
 34
34 -
 35
35 -
 36
36 -
 37
37 -
 38
38 -
 39
39 -
 40
40 -
 41
41 -
 42
42 -
 43
43 -
 44
44 -
 45
45 -
46
-
47
-
48
-
49
-
50
-
51
-
52
-
53
-
54
-
55
-
56
-
57
-
58
-
59
-
60
-
61
-
62
-
63
-
64
-
65
-
66
-
67
-
68
-
69
-
70
-
71
-
72
-
73
-
74
-
75
-
76
-
77
-
78
-
79
-
80
-
81
-
82
-
83
-
84
-
85
-
86
-
87
-
88
-
89
-
90
-
91
-
92
-
93
-
94
-
95
-
96
-
97
-
98
-
99
-
100
-
101
-
102
-
103
-
104
-
105
-
106
-
107
-
108
 |
 |

Table of Contents
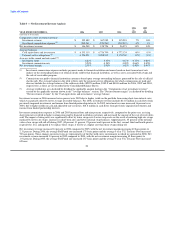
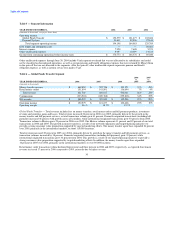
Payment Systems — Total revenue includes investment revenue, securities gains and losses, per-item fees charged to our official check
financial institution customers and fees earned on our rebate processing business. Total revenue increased five percent in 2006 compared
to 2005 due primarily to higher investment revenue, partially offset by net securities losses. Investment revenue increased due to higher
yields on the portfolio related to the increase in short-term interest rates. Total revenue for 2006 includes $10.9 million of cash flows
from previously impaired securities and income from limited partnership interests. Total revenue increased nine percent during 2005
compared to 2004 due to higher investment revenue and $2.2 million of fee revenue received upon the early termination of a customer
contract, partially offset by net securities losses. Investment revenue increased due to higher yields on the portfolio, $15.1 million of cash
flows from previously impaired securities and income from limited partnership interests. Net securities losses of $2.9 million in 2005 are
a decline from 2004 net securities gains of $7.3 million. In 2004, net securities gains were positively affected by the early pay off of a
security held in the portfolio, partially offset by impairments of certain securities and realized losses from repositioning the portfolio.
Commissions expense includes payments made to financial institution customers based on official check average investable balances and
short-term interest rate indices, as well as costs associated with swaps and the sale of receivables program. Commissions expense
increased four and eight percent in 2006 and 2005, respectively, primarily due to higher commissions paid to financial institutions as
short-term interest rates increased. Commissions expense as a percentage of revenue was relatively flat at 68 percent in 2006 as compared
to 69 percent in 2005 and 2004.
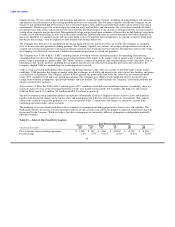
The operating margin in 2006 decreased to 12.3 percent (16.7 percent on a taxable equivalent basis) as compared to 2005 operating
margin of 13.2 percent (18.0 percent on a taxable equivalent basis), primarily due to lower average investable balances and a $0.9 million
charge for the discontinuance of a development project. The operating margin in 2005 increased to 13.2 percent (18.0 percent on a
taxable equivalent basis) as compared to 2004 operating margin of 9.2 percent (15.2 percent on a taxable equivalent basis), primarily due
to the higher investment revenue. The cash flows from previously impaired securities, income from limited partnership interests and
termination fee contributed a combined 2.6 percentage points and 4.9 percentage points, respectively, to the operating margin in each of
2006 and 2005. Operating income in 2004 includes $7.3 million of net securities gains and a charge of $2.1 million related to intangible
assets.
LIQUIDITY AND CAPITAL RESOURCES
One of our primary financial goals is to maintain adequate liquidity to manage the fluctuations in the balances of payment service assets
and obligations resulting from sales of official checks, money orders and other payment instruments, the timing of the collections of
receivables, and the timing of the presentment of such instruments for payment. In addition, we strive to maintain adequate liquidity for
capital expenditures and other normal operating cash needs.
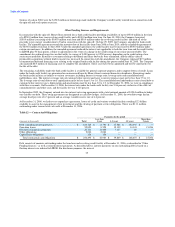
At December 31, 2006, we had cash and cash equivalents of $974 million, net receivables of $1,759 million and investments of
$5,836 million, all substantially restricted for payment service obligations. We rely on the funds from ongoing sales of payment
instruments and portfolio cash flows to settle payment service obligations as they are presented. Due to the continuous nature of the sales
and settlement of our payment instruments, we are able to invest in securities with a longer term than the average life of our payment
instruments.
The Company is regulated by various state agencies which generally require us to maintain liquid assets and investments with an
investment rating of A or higher in an amount generally equal to the payment service obligation for those regulated payment instruments,
namely teller checks, agent checks, money orders, and money transfers. Consequently, a significant amount of cash and cash equivalents,
receivables and investments are restricted to satisfy the liability to pay the face amount of regulated payment service obligations upon
presentment. The Company is not regulated by state agencies for payment service obligations resulting from outstanding cashier's checks;
however, the Company restricts a portion of the funds related to these payment instruments due to contractual arrangements and/or
Company policy. Assets restricted for regulatory or contractual reasons are not available to satisfy working capital or other financing
requirements. The regulatory and contractual requirements do not require the Company to specify individual assets held to meet our
payment service obligations; nor is the Company required to deposit specific assets into a trust, escrow or other special account. Rather,
the Company must maintain a pool of liquid assets. No third party places limitations, legal or otherwise, on the Company regarding the
32