MoneyGram 2006 Annual Report Download - page 63
Download and view the complete annual report
Please find page 63 of the 2006 MoneyGram annual report below. You can navigate through the pages in the report by either clicking on the pages listed below, or by using the keyword search tool below to find specific information within the annual report.-
 1
1 -
2
-
3
-
4
-
5
-
6
-
7
-
8
-
9
-
10
-
11
-
12
-
13
-
14
-
15
-
16
-
17
-
18
-
19
-
20
-
21
-
22
-
23
-
24
-
25
-
26
-
27
-
28
-
29
-
30
-
31
-
32
-
33
-
34
-
35
-
36
-
37
-
38
-
39
-
40
-
41
-
42
-
43
-
44
-
45
-
46
-
47
-
48
-
49
-
50
-
51
-
52
-
 53
53 -
 54
54 -
 55
55 -
 56
56 -
 57
57 -
 58
58 -
 59
59 -
 60
60 -
 61
61 -
 62
62 -
 63
63 -
 64
64 -
 65
65 -
 66
66 -
 67
67 -
 68
68 -
 69
69 -
 70
70 -
 71
71 -
 72
72 -
 73
73 -
74
-
75
-
76
-
77
-
78
-
79
-
80
-
81
-
82
-
83
-
84
-
85
-
86
-
87
-
88
-
89
-
90
-
91
-
92
-
93
-
94
-
95
-
96
-
97
-
98
-
99
-
100
-
101
-
102
-
103
-
104
-
105
-
106
-
107
-
108
 |
 |
Table of Contents
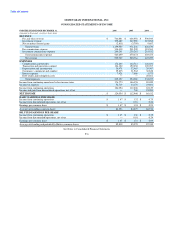
MONEYGRAM INTERNATIONAL, INC.
CONSOLIDATED STATEMENTS OF INCOME
FOR THE YEAR ENDED DECEMBER 31, 2006 2005 2004
(Amounts in thousands, except per share data)
REVENUE
Fee and other revenue $ 766,881 $ 606,956 $ 500,940
Investment revenue 395,489 367,989 315,983
Net securities (losses) gains (2,811) (3,709) 9,607
Total revenue 1,159,559 971,236 826,530
Fee commissions expense 314,418 231,209 183,561
Investment commissions expense 249,241 239,263 219,912
Total commissions expense 563,659 470,472 403,473
Net revenue 595,900 500,764 423,057
EXPENSES
Compensation and benefits 172,264 132,715 126,641
Transaction and operations support 164,122 150,038 120,767
Depreciation and amortization 38,978 32,465 29,567
Occupancy, equipment and supplies 35,835 31,562 30,828
Interest expense 7,928 7,608 5,573
Debt tender and redemption costs — — 20,661
Total expenses 419,127 354,388 334,037
Income from continuing operations before income taxes 176,773 146,376 89,020
Income tax expense 52,719 34,170 23,891
Income from continuing operations 124,054 112,206 65,129
Income and gain from discontinued operations, net of tax — 740 21,283
NET INCOME $ 124,054 $ 112,946 $ 86,412
BASIC EARNINGS PER SHARE
Income from continuing operations $ 1.47 $ 1.32 $ 0.75
Income from discontinued operations, net of tax — 0.01 0.24
Earnings per common share $ 1.47 $ 1.33 $ 0.99
Average outstanding common shares 84,294 84,675 86,916
DILUTED EARNINGS PER SHARE
Income from continuing operations $ 1.45 $ 1.30 $ 0.75
Income from discontinued operations, net of tax — 0.01 0.24
Earnings per common share $ 1.45 $ 1.31 $ 0.99
Average outstanding and potentially dilutive common shares 85,818 85,970 87,330
See Notes to Consolidated Financial Statements
F-6