MoneyGram 2006 Annual Report Download - page 28
Download and view the complete annual report
Please find page 28 of the 2006 MoneyGram annual report below. You can navigate through the pages in the report by either clicking on the pages listed below, or by using the keyword search tool below to find specific information within the annual report.-
 1
1 -
2
-
3
-
4
-
5
-
6
-
7
-
8
-
9
-
10
-
11
-
12
-
13
-
14
-
15
-
16
-
17
-
 18
18 -
 19
19 -
 20
20 -
 21
21 -
 22
22 -
 23
23 -
 24
24 -
 25
25 -
 26
26 -
 27
27 -
 28
28 -
 29
29 -
 30
30 -
 31
31 -
 32
32 -
 33
33 -
 34
34 -
 35
35 -
 36
36 -
 37
37 -
 38
38 -
39
-
40
-
41
-
42
-
43
-
44
-
45
-
46
-
47
-
48
-
49
-
50
-
51
-
52
-
53
-
54
-
55
-
56
-
57
-
58
-
59
-
60
-
61
-
62
-
63
-
64
-
65
-
66
-
67
-
68
-
69
-
70
-
71
-
72
-
73
-
74
-
75
-
76
-
77
-
78
-
79
-
80
-
81
-
82
-
83
-
84
-
85
-
86
-
87
-
88
-
89
-
90
-
91
-
92
-
93
-
94
-
95
-
96
-
97
-
98
-
99
-
100
-
101
-
102
-
103
-
104
-
105
-
106
-
107
-
108
 |
 |

Table of Contents
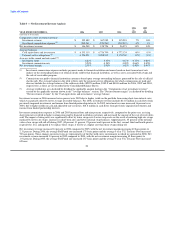
to global brand initiatives and higher professional fees to support technology systems enhancements. These increased expenses were
partially offset by lower agent credit losses.
Total revenue and net revenue in 2005 each increased by 18 percent over 2004, driven by transaction growth in the money transfer
business and cash recoveries on previously impaired securities and income from limited partnerships. Total expenses, excluding
commissions, increased in 2005 by 6 percent over 2004. Total expenses in 2004 include debt tender and redemption costs of
$20.7 million related to the redemption of Viad's preferred shares and tender for its subordinated debt and medium term notes in
connection with the spin-off. Other expenses in 2005 increased 13 percent over 2004 primarily due to transaction growth, marketing and
employee-related expenses supporting our revenue growth.
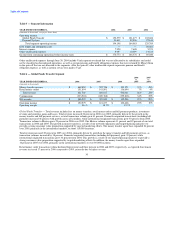
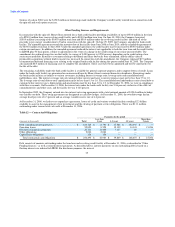
Table 2 — Net Fee Revenue Analysis
2006 2005
vs. vs.
YEAR ENDED DECEMBER 31, 2006 2005 2004 2005 2004
(Amounts in thousands)
Fee and other revenue $ 766,881 $ 606,956 $ 500,940 26% 21%
Fee commissions expense (314,418) (231,209) (183,561) 36% 26%
Net fee revenue $ 452,463 $ 375,747 $ 317,379 20% 18%
Commissions as a % of fee and other revenue 41.0% 38.1% 36.6%
Fee and other revenue includes fees on money transfer, money order and official check transactions. It is a growing portion of our total
revenue, increasing to 66 percent of total revenue for 2006 from 62 percent in 2005. Compared to 2005, fee and other revenue grew
26 percent in 2006, primarily driven by transaction growth in our money transfer and bill payment services, with volumes increasing
41 percent during the year. Total revenue growth rates are lower than money transfer volume growth rates due to simplified pricing in the
money transfer business and product mix (higher money transfer and bill payment volume growth with a decline in money order
transactions). Also, our domestic transactions, which contribute lower revenue per transaction, are growing at a faster rate than
internationally originated transactions. Our simplified pricing initiatives include reducing the number of pricing tiers or bands and allow
us to manage our price-volume dynamic while streamlining the point of sale process for our agents and customers. Our pricing
philosophy continues to be to maintain a price point below our higher priced competitor but above the niche players in the market. The
gap between total revenue growth and money transfer transaction growth narrowed in the fourth quarter of 2006 as we began to lap the
first year of implementation of simplified pricing initiatives.
For 2005 and 2004, fee and other revenue was 62 and 61 percent of total revenue, respectively, with 21 percent growth in 2005 versus the
prior year. This growth was primarily driven by transaction growth in our money transfer and bill payment services, with volume
increasing 38 percent during the year. As in 2006, revenue growth rates were lower than money transfer volume growth rates, for the
same reasons.
Fee commissions consist primarily of fees paid to our third-party agents for the money transfer service. Fee commissions expense was up
36 percent for 2006 as compared to the prior year, primarily driven by higher transaction volume and tiered commissions. Tiered
commissions are commission rates that are adjusted upward, subject to certain caps, as an agent's transaction volume grows. We use
tiered commission rates as an incentive for select agents to grow transaction volume by paying our agents for performance and allowing
them to participate in adding market share for MoneyGram. Fiscal 2005 fee commissions expense increased 26 percent over 2004, again
primarily due to higher transaction volume.
Net fee revenue increased 20 percent in 2006 compared to 2005, driven by the increase in volume of money transfer and bill payment
transactions. Growth in net fee revenue was lower than fee and other revenue growth primarily due to product mix and tiered
commissions expense. Net fee revenue increased 18 percent in 2005 compared to 2004, primarily due to the increase in money transfer
and bill payment transaction volumes. Growth in net fee revenue was lower than fee and other revenue growth in 2004, primarily due to
the pricing structure of certain large money order agents, as well as product mix.
25