MoneyGram 2006 Annual Report Download - page 36
Download and view the complete annual report
Please find page 36 of the 2006 MoneyGram annual report below. You can navigate through the pages in the report by either clicking on the pages listed below, or by using the keyword search tool below to find specific information within the annual report.-
 1
1 -
2
-
3
-
4
-
5
-
6
-
7
-
8
-
9
-
10
-
11
-
12
-
13
-
14
-
15
-
16
-
17
-
18
-
19
-
20
-
21
-
22
-
23
-
24
-
25
-
 26
26 -
 27
27 -
 28
28 -
 29
29 -
 30
30 -
 31
31 -
 32
32 -
 33
33 -
 34
34 -
 35
35 -
 36
36 -
 37
37 -
 38
38 -
 39
39 -
 40
40 -
 41
41 -
 42
42 -
 43
43 -
 44
44 -
 45
45 -
 46
46 -
47
-
48
-
49
-
50
-
51
-
52
-
53
-
54
-
55
-
56
-
57
-
58
-
59
-
60
-
61
-
62
-
63
-
64
-
65
-
66
-
67
-
68
-
69
-
70
-
71
-
72
-
73
-
74
-
75
-
76
-
77
-
78
-
79
-
80
-
81
-
82
-
83
-
84
-
85
-
86
-
87
-
88
-
89
-
90
-
91
-
92
-
93
-
94
-
95
-
96
-
97
-
98
-
99
-
100
-
101
-
102
-
103
-
104
-
105
-
106
-
107
-
108
 |
 |
Table of Contents
use of its individual liquid assets. The Company is able to withdraw, deposit and/or sell its individual liquid assets at will, with no prior
notice or penalty, provided the Company maintains a total pool of liquid assets sufficient to meet the regulatory and contractual
requirements.
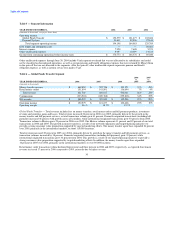
As of December 31, 2006 and 2005, we had unrestricted cash and cash equivalents, receivables, and investments to the extent those assets
exceed all payment service obligations as summarized in Table 8. These amounts are generally available; however, management
considers a portion of these amounts as providing additional assurance that regulatory requirements are maintained during the normal
fluctuations in the value of investments.
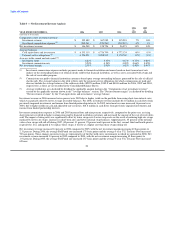
Table 8 — Unrestricted Assets
(Amounts in thousands) 2006 2005
Cash and cash equivalents $ 973,931 $ 698,691
Receivables, net 1,758,682 1,425,622
Trading investments 145,500 167,700
Available for sale investments 5,690,600 6,233,333
8,568,713 8,525,346
Amounts restricted to cover payment service obligations (8,209,789) (8,159,309)
Unrestricted assets $ 358,924 $ 366,037
The decline in unrestricted assets is primarily due to fluctuations in the market value of our investments and higher levels of capital
expenditures and repurchases of our common stock, payment of dividends and the acquisition of MoneyExpress, as well as changes in
our working capital resulting from the timing of normal operating activities.
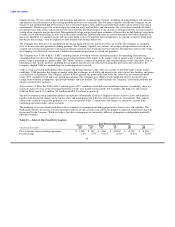
Table 9 — Cash Flows Provided By or Used In Operating Activities
YEAR ENDED DECEMBER 31, 2006 2005 2004
(Amounts in thousands)
Net income $ 124,054 $ 112,946 $ 86,412
Total adjustments to reconcile net income 42,485 68,278 86,150
Net cash provided by continuing operating activities before changes in payment service assets and
obligations 166,539 181,224 172,562
Change in cash and cash equivalents (substantially restricted) (261,725) (84,817) 308,587
Change in trading investments, net (substantially restricted) 22,200 153,100 (232,650)
Change in receivables, net (substantially restricted) (335,509) (666,282) (22,654)
Change in payment service obligations 38,489 518,728 219,100
Net change in payment service assets and obligations (536,545) (79,271) 272,383
Net cash (used in) provided by continuing operating activities $(370,006) $ 101,953 $ 444,945
Table 9 summarizes the cash flows (used in) provided by continuing operating activities. For 2006, net cash provided by continuing
operating activities before changes in payment service assets and obligations decreased $14.7 million to $166.5 million from
$181.2 million for 2005. This decrease was primarily due to the timing of payment on other assets and accounts payable and other
liabilities. Net cash provided by continuing operating activities before changes in payment service assets and obligations increased
$8.7 million in 2005 from $172.6 million for 2004. The increase was primarily due to the timing of payment on other assets and accounts
payable and other liabilities.
To understand the cash flow activity of our business, the cash provided by (used in) operating activities relating to the payment service
assets and obligations should be reviewed in conjunction with the cash provided by (used in) investing activities related to our investment
portfolio.
33