MoneyGram 2006 Annual Report Download - page 96
Download and view the complete annual report
Please find page 96 of the 2006 MoneyGram annual report below. You can navigate through the pages in the report by either clicking on the pages listed below, or by using the keyword search tool below to find specific information within the annual report.-
 1
1 -
2
-
3
-
4
-
5
-
6
-
7
-
8
-
9
-
10
-
11
-
12
-
13
-
14
-
15
-
16
-
17
-
18
-
19
-
20
-
21
-
22
-
23
-
24
-
25
-
26
-
27
-
28
-
29
-
30
-
31
-
32
-
33
-
34
-
35
-
36
-
37
-
38
-
39
-
40
-
41
-
42
-
43
-
44
-
45
-
46
-
47
-
48
-
49
-
50
-
51
-
52
-
53
-
54
-
55
-
56
-
57
-
58
-
59
-
60
-
61
-
62
-
63
-
64
-
65
-
66
-
67
-
68
-
69
-
70
-
71
-
72
-
73
-
74
-
75
-
76
-
77
-
78
-
79
-
80
-
81
-
82
-
83
-
84
-
85
-
 86
86 -
 87
87 -
 88
88 -
 89
89 -
 90
90 -
 91
91 -
 92
92 -
 93
93 -
 94
94 -
 95
95 -
 96
96 -
 97
97 -
 98
98 -
 99
99 -
 100
100 -
 101
101 -
 102
102 -
 103
103 -
 104
104 -
 105
105 -
 106
106 -
107
-
108
 |
 |

Table of Contents
MONEYGRAM INTERNATIONAL, INC. AND SUBSIDIARIES
NOTES TO CONSOLIDATED FINANCIAL STATEMENTS — (Continued)
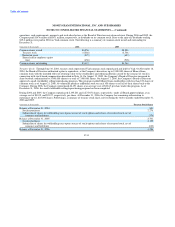
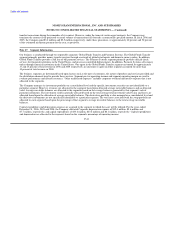
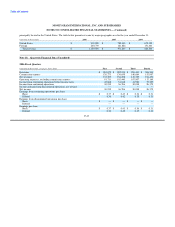
Restricted stock awards were valued at the quoted market price of the Company's common stock on the date of grant and expensed using
the straight-line method over the vesting or service period of the award. Following is a summary of restricted stock activity:
Weighted
Total Average
Shares Price
Restricted stock outstanding at December 31, 2005 692,939 $ 18.28
Granted 114,570 $ 27.51
Vested and issued (473,742) $ 17.68
Forfeited (10,769) $ 19.34
Restricted stock outstanding at December 31, 2006 322,998 $ 22.39
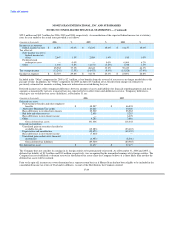
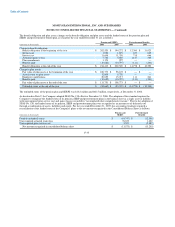
Following is a summary of pertinent information related to the Company's stock-based awards:
(Amounts in thousands) 2006 2005 2004
Fair value of options vesting during period $ 5,680 $ 9,256 $ 20,194
Fair value of restricted stock vesting during period 13,245 9,916 5,840
Expense recognized related to options 2,725 1,492 —
Expense recognized related to restricted stock 1,950 2,310 1,934
Intrinsic value of options exercised 15,490 5,075 4,492
Cash received from option exercises and vesting of restricted stock 21,899 15,022 1,692
Tax benefit realized for tax deductions from option exercises and vesting of restricted stock 2,744 1,776 1,572
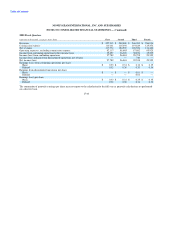
(Amounts in thousands) Options Restricted Stock
Unrecognized compensation expense $ 4,639 $ 2,873
Remaining weighted average vesting period 1.9 years 1.8 years
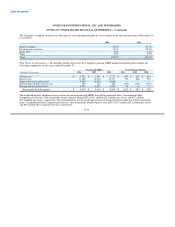
Assuming that the Company had recognized compensation cost for stock option grants in accordance with the fair value method of
accounting prior to January 1, 2005, net income and diluted and basic income per share would be as follows:
(Amounts in thousands, except per share data) 2004
Net income, as reported $ 86,412
Plus: stock-based compensation expense recorded under APB 25, net of tax 1,483
Less: stock-based compensation expense determined under the fair value method, net of tax (3,869)
Pro forma net income $ 84,026
Basic earnings per share:
As reported $ 0.99
Pro forma $ 0.97
Diluted earnings per share:
As reported $ 0.99
Pro forma $ 0.96
F-39