MoneyGram 2006 Annual Report Download - page 32
Download and view the complete annual report
Please find page 32 of the 2006 MoneyGram annual report below. You can navigate through the pages in the report by either clicking on the pages listed below, or by using the keyword search tool below to find specific information within the annual report.-
 1
1 -
2
-
3
-
4
-
5
-
6
-
7
-
8
-
9
-
10
-
11
-
12
-
13
-
14
-
15
-
16
-
17
-
18
-
19
-
20
-
21
-
 22
22 -
 23
23 -
 24
24 -
 25
25 -
 26
26 -
 27
27 -
 28
28 -
 29
29 -
 30
30 -
 31
31 -
 32
32 -
 33
33 -
 34
34 -
 35
35 -
 36
36 -
 37
37 -
 38
38 -
 39
39 -
 40
40 -
 41
41 -
 42
42 -
43
-
44
-
45
-
46
-
47
-
48
-
49
-
50
-
51
-
52
-
53
-
54
-
55
-
56
-
57
-
58
-
59
-
60
-
61
-
62
-
63
-
64
-
65
-
66
-
67
-
68
-
69
-
70
-
71
-
72
-
73
-
74
-
75
-
76
-
77
-
78
-
79
-
80
-
81
-
82
-
83
-
84
-
85
-
86
-
87
-
88
-
89
-
90
-
91
-
92
-
93
-
94
-
95
-
96
-
97
-
98
-
99
-
100
-
101
-
102
-
103
-
104
-
105
-
106
-
107
-
108
 |
 |

Table of Contents
Acquisition
On May 31, 2006, MoneyGram completed the acquisition of MoneyExpress, the Company's former super agent in Italy. In connection
with the acquisition, the Company formed MoneyGram Payment Systems Italy, a wholly-owned subsidiary, to operate the former Money
Express network. The acquisition provides the Company with the opportunity for further network expansion and more control of
marketing and promotional activities in the region. The operating results of MoneyExpress subsequent to May 31, 2006 are included in
the Company's consolidated statement of income.
MoneyGram acquired MoneyExpress for $15.0 million, subject to purchase price adjustments. The acquisition cost includes $1.3 million
of transaction costs and the forgiveness of $0.7 million of liabilities. During the third quarter of 2006, the Company received a purchase
price adjustment of $6.0 million. The Company is in the process of finalizing the valuation of intangible assets, among other items from
this acquisition, which may result in adjustment to the purchase price allocation. Purchased intangible assets of $7.2 million, consisting
primarily of agent contracts and a non-competition agreement, will be amortized over useful lives ranging from 3 to 5 years. Preliminary
goodwill of $17.0 million was recorded and assigned to our Global Funds Transfer segment.
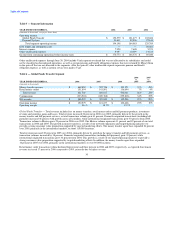
Segment Performance
We measure financial performance by our two business segments:
Global Funds Transfer — this segment provides global money transfer services, money orders and bill payment services to consumers
through a network of agents. Fee revenue is driven by transaction volume and fees per transaction. In addition, investment and related
income is generated by investing funds received from the sale of money orders until the instruments are settled.
Payment Systems — this segment provides financial institutions with payment processing services, primarily official check
outsourcing services and money orders for sale to their customers, and processes controlled disbursements. Investment and related
income is generated by investing funds received from the sale of payment instruments until the instruments are settled. In addition,
revenue is derived from per-item fees paid by our financial institution customers.
The business segments are determined based upon factors such as the type of customers, the nature of products and services provided and
the distribution channels used to provide those services. Segment pre-tax operating income and segment operating margin are used to
evaluate performance and allocate resources.
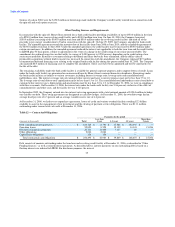
We manage our investment portfolio on a consolidated level and the specific investment securities are not identifiable to a particular
segment. However, average investable balances are allocated to our segments based upon the average balances generated by that
segment's sale of payment instruments. The investment yield generally is allocated based upon the total average investment yield. Gains
and losses are allocated based upon the allocation of average investable balances. Our derivatives portfolio is also managed on a
consolidated level and the derivative instruments are not specifically identifiable to a particular segment. The total costs associated with
our derivatives portfolio are allocated to each segment based upon the percentage of that segment's average investable balances to the
total average investable balances. Table 5 reconciles segment operating income to income from continuing operations before income
taxes as reported in the financial statements.
29