MoneyGram 2006 Annual Report Download - page 27
Download and view the complete annual report
Please find page 27 of the 2006 MoneyGram annual report below. You can navigate through the pages in the report by either clicking on the pages listed below, or by using the keyword search tool below to find specific information within the annual report.-
 1
1 -
2
-
3
-
4
-
5
-
6
-
7
-
8
-
9
-
10
-
11
-
12
-
13
-
14
-
15
-
16
-
 17
17 -
 18
18 -
 19
19 -
 20
20 -
 21
21 -
 22
22 -
 23
23 -
 24
24 -
 25
25 -
 26
26 -
 27
27 -
 28
28 -
 29
29 -
 30
30 -
 31
31 -
 32
32 -
 33
33 -
 34
34 -
 35
35 -
 36
36 -
 37
37 -
38
-
39
-
40
-
41
-
42
-
43
-
44
-
45
-
46
-
47
-
48
-
49
-
50
-
51
-
52
-
53
-
54
-
55
-
56
-
57
-
58
-
59
-
60
-
61
-
62
-
63
-
64
-
65
-
66
-
67
-
68
-
69
-
70
-
71
-
72
-
73
-
74
-
75
-
76
-
77
-
78
-
79
-
80
-
81
-
82
-
83
-
84
-
85
-
86
-
87
-
88
-
89
-
90
-
91
-
92
-
93
-
94
-
95
-
96
-
97
-
98
-
99
-
100
-
101
-
102
-
103
-
104
-
105
-
106
-
107
-
108
 |
 |

Table of Contents
We incur commission expense on our money transfer products and our investments. We pay fee commissions to our third-party agents for
money transfer services. In a money transfer transaction, both the agent initiating the transaction and the agent disbursing the funds
receive a commission. The commission amount generally is based on a percentage of the fee charged to the consumers. We generally do
not pay commissions to agents on the sale of money orders. Fee commissions also include the amortization of capitalized incentive
payments to agents.
Investment commissions are amounts paid to financial institution customers based on the average outstanding cash balances generated by
the sale of official checks, as well as costs associated with swaps and the sale of receivables program. In connection with our interest rate
swaps, we pay a fixed amount to a counterparty and receive a variable rate payment in return. To the extent that the fixed rate exceeds the
variable rate, we incur an expense related to the swap; conversely, if the variable rate exceeds the fixed rate, we receive income related to
the swap. Under our receivables program, we sell our receivables at a discount to accelerate our cash flow; this discount is recorded as an
expense. Commissions paid to financial institution customers generally are variable based on short-term interest rates. We utilize interest
rate swaps, as described above, to convert a portion of our variable rate commission payments to fixed rate payments. These swaps assist
us in managing the interest rate risk associated with the variable rate commissions paid to our financial institution customers.
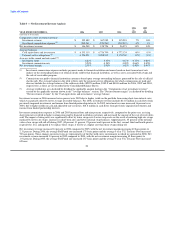
Table 1 — Results of Operations
2006 2005 As a Percentage
vs. vs. of Total Revenue
YEAR ENDED DECEMBER 31, 2006 2005 2004 2005 2004 2006 2005 2004
(%) (%) (%) (%) (%)
(Amounts in thousands)
Revenue:
Fee and other revenue $ 766,881 $ 606,956 $ 500,940 26 21 66 62 61
Investment revenue 395,489 367,989 315,983 7 16 34 38 38
Net securities (losses) gains (2,811) (3,709) 9,607 NM NM 0 0 1
Total revenue 1,159,559 971,236 826,530 19 18 100 100 100
Fee commissions expense 314,418 231,209 183,561 36 26 27 24 22
Investment commissions
expense 249,241 239,263 219,912 4 9 22 25 27
Total commissions
expense 563,659 470,472 403,473 20 17 49 49 49
Net revenue 595,900 500,764 423,057 19 18 51 51 51
Expenses:
Compensation and benefits 172,264 132,715 126,641 30 5 15 14 15
Transaction and operations
support 164,122 150,038 120,767 9 24 14 15 15
Depreciation and
amortization 38,978 32,465 29,567 20 10 3 3 4
Occupancy, equipment and
supplies 35,835 31,562 30,828 14 2 3 3 3
Interest expense 7,928 7,608 5,573 4 37 1 1 1
Debt tender and redemption
costs — — 20,661 NM NM 0 0 2
Total expenses 419,127 354,388 334,037 18 6 36 36 40
Income from continuing
operations before income
taxes 176,773 146,376 89,020 21 64 15 15 11
Income tax expense 52,719 34,170 23,891 54 43 4 4 3
Income from continuing
operations $ 124,054 $ 112,206 $ 65,129 11 72 11 11 8
NM = Not meaningful
For the year ended December 31, 2006, total revenue and net revenue each grew by 19 percent over 2005 due to 41 percent growth in
money transfer transaction volume. Total expenses, excluding commissions, increased 18 percent over 2005, which reflects additional
headcount to support growth, increased marketing expenditures due
24