MoneyGram 2006 Annual Report Download - page 37
Download and view the complete annual report
Please find page 37 of the 2006 MoneyGram annual report below. You can navigate through the pages in the report by either clicking on the pages listed below, or by using the keyword search tool below to find specific information within the annual report.-
 1
1 -
2
-
3
-
4
-
5
-
6
-
7
-
8
-
9
-
10
-
11
-
12
-
13
-
14
-
15
-
16
-
17
-
18
-
19
-
20
-
21
-
22
-
23
-
24
-
25
-
26
-
 27
27 -
 28
28 -
 29
29 -
 30
30 -
 31
31 -
 32
32 -
 33
33 -
 34
34 -
 35
35 -
 36
36 -
 37
37 -
 38
38 -
 39
39 -
 40
40 -
 41
41 -
 42
42 -
 43
43 -
 44
44 -
 45
45 -
 46
46 -
 47
47 -
48
-
49
-
50
-
51
-
52
-
53
-
54
-
55
-
56
-
57
-
58
-
59
-
60
-
61
-
62
-
63
-
64
-
65
-
66
-
67
-
68
-
69
-
70
-
71
-
72
-
73
-
74
-
75
-
76
-
77
-
78
-
79
-
80
-
81
-
82
-
83
-
84
-
85
-
86
-
87
-
88
-
89
-
90
-
91
-
92
-
93
-
94
-
95
-
96
-
97
-
98
-
99
-
100
-
101
-
102
-
103
-
104
-
105
-
106
-
107
-
108
 |
 |
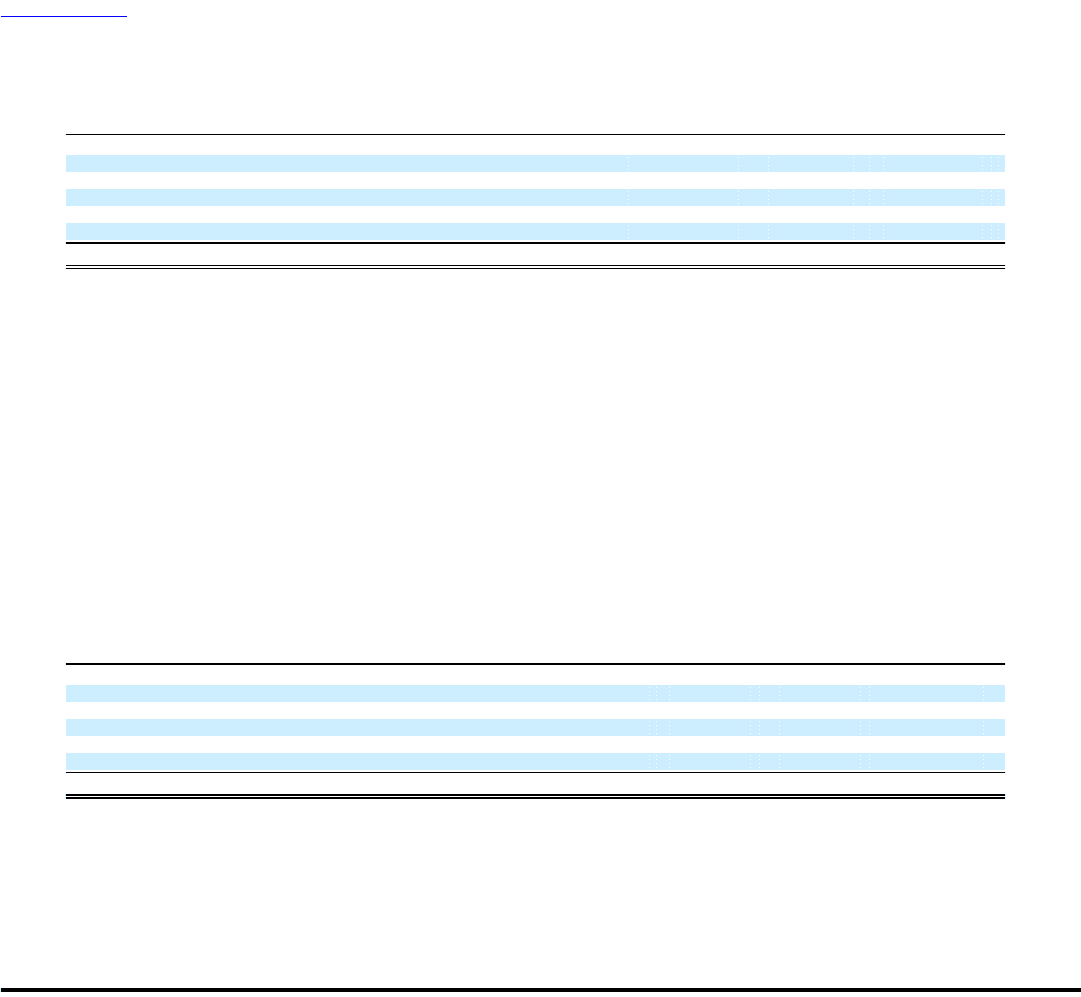
Table of Contents
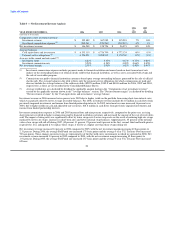
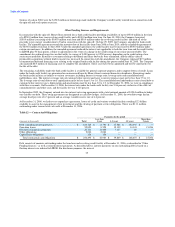
Table 10 — Cash Flows Provided By or Used In Investing Activities
YEAR ENDED DECEMBER 31, 2006 2005 2004
(Amounts in thousands)
Net investment activity $ 516,008 $ (6,099) $ (246,603)
Purchases of property and equipment (81,033) (47,359) (29,589)
Cash paid for acquisitions (7,311) (8,535) —
Proceeds from sale of Game Financial Corporation — — 15,247
Other — (700) 428
Net cash provided by (used in) investing activities $ 427,664 $ (62,693) $ (260,517)
Table 10 summarizes the net cash provided by (used in) investing activities. Investing activities primarily consist of activity within our
investment portfolio as previously discussed. We used cash of $88.3 million, $56.6 million and $13.9 million in 2006, 2005 and 2004,
respectively, for other investing activity. In 2006 and 2005, we paid $7.3 million and $8.5 million to acquire Money Express and ACH
Commerce, respectively. In 2004, we received $15.2 million in proceeds from the sale of Game Financial Corporation. Capital
expenditures for property and equipment of $81.0 million, $47.4 million and $29.6 million in 2006, 2005 and 2004, respectively,
primarily relate to our continued investment in the money transfer platform.
In addition, the Company sold securities with a fair value of $259.7 million to one party (the "acquiring party") during the third quarter of
2006. No restrictions or constraints as to the future use of the securities were placed upon the acquiring party by the Company, nor was
the Company obligated under any scenario to repurchase securities from the acquiring party. In August 2006, the acquiring party sold
securities totaling $646.8 million of a qualifying special purpose entity ("QSPE"), including substantially all of the securities originally
purchased from the Company. The Company acquired the preferred shares of the QSPE and accounts for this investment at fair value as
an available-for-sale investment in accordance with SFAS No. 115, Accounting for Certain Investments in Debt and Equity Securities. At
December 31, 2006, the fair value of the preferred shares was $7.8 million. In addition, a subsidiary of the Company serves as the
collateral advisor to the QSPE, receiving certain fees and rights standard to a collateral advisor role. Activities performed by the collateral
advisor are significantly limited and are entirely defined by the legal documents establishing the QSPE. For performing these activities,
the collateral advisor receives a quarterly fee equal to ten basis points on the fair value of the collateral. The collateral advisor also
received and recognized a one-time fee of $0.4 million in August 2006 for the placement of the preferred shares of the QSPE.
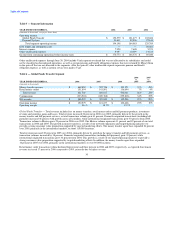
Table 11 — Cash Flows Used in Financing Activities
YEAR ENDED DECEMBER 31, 2006 2005 2004
(Amounts in thousands)
Net debt activity $ — $ — $ (55,182)
Proceeds and tax benefit from exercise of stock options 24,643 16,798 3,264
Preferred stock redemption — — (23,895)
Purchase of treasury stock (67,856) (50,000) (16,181)
Cash dividends paid (14,445) (6,058) (17,408)
Net cash used in financing activities $ (57,658) $ (39,260) $ (109,402)
Table 11 summarizes the net cash provided by (used in) financing activities. Net cash used in financing activities was $57.7 million,
$39.3 million and $109.4 million in 2006, 2005 and 2004, respectively. During 2006, we used cash of $67.9 million to repurchase our
common stock and $14.4 million to pay dividends. During 2005, we used cash of $50.0 million to repurchase our common stock and
$6.1 million to pay dividends. Sources of cash in 2006 and 2005 relate solely to stock option exercises. During 2004, cash was used for
the redemption of Viad's debt and redeemable preferred stock for approximately $203.0 million and $23.9 million, respectively, payments
of dividends totaling $17.4 million and the purchase of treasury stock for $16.2 million. Dividends paid and treasury stock purchased by
the Company subsequent to the spin-off totaled $1.8 million and $16.2 million, respectively.
34