MoneyGram 2006 Annual Report Download - page 78
Download and view the complete annual report
Please find page 78 of the 2006 MoneyGram annual report below. You can navigate through the pages in the report by either clicking on the pages listed below, or by using the keyword search tool below to find specific information within the annual report.-
 1
1 -
2
-
3
-
4
-
5
-
6
-
7
-
8
-
9
-
10
-
11
-
12
-
13
-
14
-
15
-
16
-
17
-
18
-
19
-
20
-
21
-
22
-
23
-
24
-
25
-
26
-
27
-
28
-
29
-
30
-
31
-
32
-
33
-
34
-
35
-
36
-
37
-
38
-
39
-
40
-
41
-
42
-
43
-
44
-
45
-
46
-
47
-
48
-
49
-
50
-
51
-
52
-
53
-
54
-
55
-
56
-
57
-
58
-
59
-
60
-
61
-
62
-
63
-
64
-
65
-
66
-
67
-
 68
68 -
 69
69 -
 70
70 -
 71
71 -
 72
72 -
 73
73 -
 74
74 -
 75
75 -
 76
76 -
 77
77 -
 78
78 -
 79
79 -
 80
80 -
 81
81 -
 82
82 -
 83
83 -
 84
84 -
 85
85 -
 86
86 -
 87
87 -
 88
88 -
89
-
90
-
91
-
92
-
93
-
94
-
95
-
96
-
97
-
98
-
99
-
100
-
101
-
102
-
103
-
104
-
105
-
106
-
107
-
108
 |
 |

Table of Contents
MONEYGRAM INTERNATIONAL, INC. AND SUBSIDIARIES
NOTES TO CONSOLIDATED FINANCIAL STATEMENTS — (Continued)
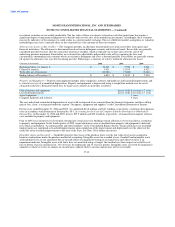
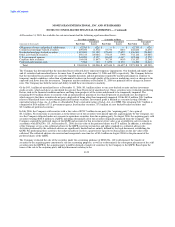
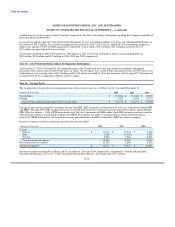
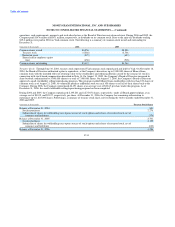
Amortized Fair
(Amounts in thousands) Cost Value
In one year or less $ 31,086 $ 31,209
After one year through five years 555,250 563,596
After five years through ten years 531,469 543,766
After ten years 301,934 308,934
Mortgage-backed and other asset-backed securities 4,200,995 4,215,244
Preferred and common stock 30,175 27,851
Total $ 5,650,909 $ 5,690,600
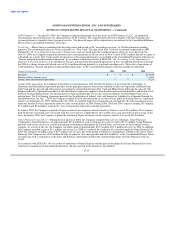
At December 31, 2006 and 2005, net unrealized gains of $39.7 million ($24.6 million net of tax) and $61.8 million ($38.3 million net of
tax), respectively, are included in the Consolidated Balance Sheets in "Accumulated other comprehensive income (loss)." During 2006,
2005 and 2004, gains (losses) of $1.7 million, $2.3 million and $(6.0) million, respectively, were reclassified from "Accumulated other
comprehensive income (loss)" to earnings in connection with the sale of the underlying securities.
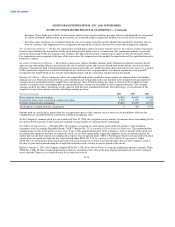
Gross realized gains and losses on sales of investments, using the specific identification method, and other-than-temporary impairments
were as follows for the year ended December 31:
(Amounts in thousands) 2006 2005 2004
Gross realized gains $ 5,080 $ 7,378 $ 31,903
Gross realized losses (2,653) (4,535) (6,364)
Other-than-temporary impairments (5,238) (6,552) (15,932)
Net securities (losses) gains $ (2,811) $ (3,709) $ 9,607
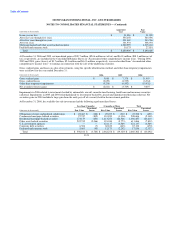
Impairments in 2006 related to investments backed by automobile, aircraft, manufactured housing, bank loans and insurance securities
collateral. Impairments in 2005 and 2004 related primarily to investments backed by aircraft and manufactured housing collateral. Net
securities gains in 2004 included a large gain from the early pay off of a security held in the investment portfolio.
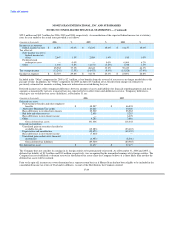
At December 31, 2006, the available-for-sale investments had the following aged unrealized losses:
Less than 12 months 12 months or More Total
Unrealized Unrealized Unrealized
(Amounts in thousands) Fair Value Losses Fair Value Losses Fair Value Losses
Obligations of states and political subdivisions $ 22,467 $ (180) $ 25,075 $ (310) $ 47,542 $ (490)
Commercial mortgage-backed securities 97,747 (812) 110,859 (1,336) 208,606 (2,148)
Residential mortgage-backed securities 173,179 (653) 1,213,278 (22,566) 1,386,457 (23,219)
Other asset-backed securities 292,742 (2,066) 318,944 (5,773) 611,686 (7,839)
U.S. government agencies — — 321,117 (6,589) 321,117 (6,589)
Corporate debt securities 6,306 (7) 60,832 (463) 67,138 (470)
Preferred and common stock 5,663 (45) 12,173 (2,292) 17,836 (2,337)
Total $ 598,104 $ (3,763) $ 2,062,278 $ (39,329) $ 2,660,382 $ (43,092)
F-21