MoneyGram 2006 Annual Report Download - page 65
Download and view the complete annual report
Please find page 65 of the 2006 MoneyGram annual report below. You can navigate through the pages in the report by either clicking on the pages listed below, or by using the keyword search tool below to find specific information within the annual report.-
 1
1 -
2
-
3
-
4
-
5
-
6
-
7
-
8
-
9
-
10
-
11
-
12
-
13
-
14
-
15
-
16
-
17
-
18
-
19
-
20
-
21
-
22
-
23
-
24
-
25
-
26
-
27
-
28
-
29
-
30
-
31
-
32
-
33
-
34
-
35
-
36
-
37
-
38
-
39
-
40
-
41
-
42
-
43
-
44
-
45
-
46
-
47
-
48
-
49
-
50
-
51
-
52
-
53
-
54
-
 55
55 -
 56
56 -
 57
57 -
 58
58 -
 59
59 -
 60
60 -
 61
61 -
 62
62 -
 63
63 -
 64
64 -
 65
65 -
 66
66 -
 67
67 -
 68
68 -
 69
69 -
 70
70 -
 71
71 -
 72
72 -
 73
73 -
 74
74 -
 75
75 -
76
-
77
-
78
-
79
-
80
-
81
-
82
-
83
-
84
-
85
-
86
-
87
-
88
-
89
-
90
-
91
-
92
-
93
-
94
-
95
-
96
-
97
-
98
-
99
-
100
-
101
-
102
-
103
-
104
-
105
-
106
-
107
-
108
 |
 |

Table of Contents
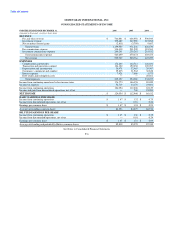
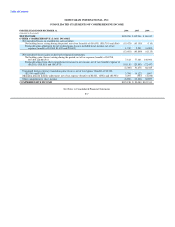
MONEYGRAM INTERNATIONAL, INC.
CONSOLIDATED STATEMENTS OF CASH FLOWS
FOR THE YEAR ENDED DECEMBER 31, 2006 2005 2004
(Amounts in thousands)
CASH FLOWS FROM OPERATING ACTIVITIES:
Net income $ 124,054 $ 112,946 $ 86,412
Adjustments to reconcile net income to net cash (used in) provided by operating activities:
Net earnings in discontinued operations — (740) (21,283)
Depreciation and amortization 38,978 32,465 29,567
Investment impairment charges 5,238 6,552 15,932
Provision for deferred income taxes 33,155 2,880 6,282
Net gain on sale of investments (2,427) (2,844) (25,539)
Debt redemption and retirement costs — — 20,661
Net amortization of investment premiums and discounts (8,208) 7,645 19,070
Asset impairments and adjustments 893 — 6,590
Provision for uncollectible receivables 3,931 12,935 6,422
Other non-cash items, net 3,051 (6,414) 4,782
Changes in foreign currency translation adjustments 3,795 (4,127) 1,807
Change in other assets (10,573) (3,201) 27,381
Change in accounts payable and other liabilities (25,348) 23,127 (5,522)
Total adjustments 42,485 68,278 86,150
Change in cash and cash equivalents (substantially restricted) (261,725) (84,817) 308,587
Change in trading investments, net (substantially restricted) 22,200 153,100 (232,650)
Change in receivables, net (substantially restricted) (335,509) (666,282) (22,654)
Change in payment service obligations 38,489 518,728 219,100
Net cash (used in) provided by continuing operating activities (370,006) 101,953 444,945
CASH FLOWS FROM INVESTING ACTIVITIES:
Proceeds from sales of investments classified as available-for-sale 425,236 486,905 939,935
Proceeds from maturities of investments classified as available-for-sale 798,224 978,554 1,798,767
Purchases of investments classified as available-for-sale (707,452) (1,471,558) (2,985,305)
Purchases of property and equipment (81,033) (47,359) (29,589)
Cash paid for acquisitions (7,311) (8,535) —
Proceeds from the sale of Game Financial Corporation, net of cash sold — — 15,247
Other investing activities — (700) 428
Net cash provided by (used in) investing activities 427,664 (62,693) (260,517)
CASH FLOWS FROM FINANCING ACTIVITIES:
Payments on debt — — (205,182)
Proceeds from debt — — 100,000
Net change in revolver — — 50,000
Proceeds and tax benefit from exercise of stock options 24,643 16,798 3,264
Preferred stock redemption — — (23,895)
Purchase of treasury stock (67,856) (50,000) (16,181)
Cash dividends paid (14,445) (6,058) (17,408)
Net cash used in financing activities (57,658) (39,260) (109,402)
CASH FLOWS OF DISCONTINUED OPERATIONS
Operating cash flows — — 360,816
Investing cash flows — — (6,730)
Financing cash flows — — (462,944)
Net cash used in discontinued operations — — (108,858)
NET DECREASE IN CASH AND CASH EQUIVALENTS — — (33,832)
CASH AND CASH EQUIVALENTS — Beginning of period — — 33,832
CASH AND CASH EQUIVALENTS — End of period $ — $ — $ —
See Notes to Consolidated Financial Statements
F-8