MoneyGram 2006 Annual Report Download - page 33
Download and view the complete annual report
Please find page 33 of the 2006 MoneyGram annual report below. You can navigate through the pages in the report by either clicking on the pages listed below, or by using the keyword search tool below to find specific information within the annual report.-
 1
1 -
2
-
3
-
4
-
5
-
6
-
7
-
8
-
9
-
10
-
11
-
12
-
13
-
14
-
15
-
16
-
17
-
18
-
19
-
20
-
21
-
22
-
 23
23 -
 24
24 -
 25
25 -
 26
26 -
 27
27 -
 28
28 -
 29
29 -
 30
30 -
 31
31 -
 32
32 -
 33
33 -
 34
34 -
 35
35 -
 36
36 -
 37
37 -
 38
38 -
 39
39 -
 40
40 -
 41
41 -
 42
42 -
 43
43 -
44
-
45
-
46
-
47
-
48
-
49
-
50
-
51
-
52
-
53
-
54
-
55
-
56
-
57
-
58
-
59
-
60
-
61
-
62
-
63
-
64
-
65
-
66
-
67
-
68
-
69
-
70
-
71
-
72
-
73
-
74
-
75
-
76
-
77
-
78
-
79
-
80
-
81
-
82
-
83
-
84
-
85
-
86
-
87
-
88
-
89
-
90
-
91
-
92
-
93
-
94
-
95
-
96
-
97
-
98
-
99
-
100
-
101
-
102
-
103
-
104
-
105
-
106
-
107
-
108
 |
 |

Table of Contents
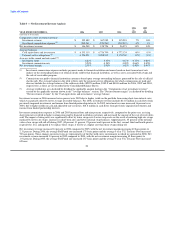
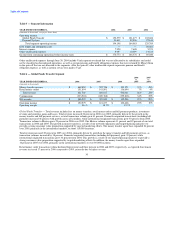
Table 5 — Segment Information
YEAR ENDED DECEMBER 31, 2006 2005 2004
(Amounts in thousands, except per share data)
Operating income:
Global Funds Transfer $ 152,579 $ 121,677 $ 102,606
Payment Systems 41,619 42,406 27,163
Total segment operating income 194,198 164,083 129,769
Debt tender and redemption costs — — 20,661
Interest expense 7,928 7,608 5,573
Other unallocated expenses 9,497 10,099 14,515
Income from continuing operations before income taxes $ 176,773 $ 146,376 $ 89,020
Other unallocated expenses through June 30, 2004 include Viad corporate overhead that was not allocated to its subsidiaries and could
not be classified as discontinued operations, as well as certain pension and benefit obligation expenses that were retained by MoneyGram
in the spin-off that are not allocated to the segments. After the spin-off, other unallocated expense represents pension and benefit
obligation expense, as well as interim service fees paid to Viad.
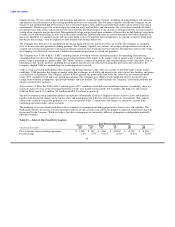
Table 6 — Global Funds Transfer Segment
2006 2005
vs. vs.
YEAR ENDED DECEMBER 31, 2006 2005 2004 2005 2004
(Amounts in thousands)
Money transfer revenue $ 669,852 $ 507,726 $ 395,370 32% 28%
Retail money orders 151,894 141,891 136,694 7% 4%
Total revenue 821,746 649,617 532,064 26% 22%
Commissions (333,524) (249,768) (199,818) 34% 25%
Net revenue $ 488,222 $ 399,849 $ 332,246 22% 20%
Operating income $ 152,579 $ 121,677 $ 102,606 25% 19%
Operating margin 18.6% 18.7% 19.3%
Global Funds Transfer — Total revenue includes fees on money transfers, retail money orders and bill payment products, investment
revenue and securities gains and losses. Total revenue increased 26 percent in 2006 over 2005, primarily driven by the growth in the
money transfer and bill payment services, as total transaction volume grew 41 percent. Domestic originated transactions (including bill
payment) increased 46 percent with growth across all corridors, while international originated transactions grew 30 percent from 2005.
Transaction volume to Mexico grew 29 percent in 2006 over 2005. Our Mexico volume represents 11 percent and 12 percent of our total
transactions in 2006 and 2005. The growth in money transfer is a result of our network expansions and targeted pricing initiatives to
provide a strong consumer value proposition supported by targeted marketing efforts. The money transfer agent base expanded 24 percent
over 2005, primarily in the international markets, to about 110,000 locations.
Total revenue increased 22 percent in 2005 over 2004, primarily driven by growth in the money transfer and bill payment services, as
transaction volumes increased by 38 percent. Domestic originated transactions (including bill payment) grew 39 percent, while
international originated transactions grew 36 percent from 2004. This growth is a result of our targeted pricing initiatives to provide a
strong consumer value proposition supported by targeted marketing efforts. In addition, the money transfer agent base expanded
16 percent in 2005 over 2004, primarily in the international markets, to over 89,000 locations.
Retail money order transaction volume declined four percent and three percent in 2006 and 2005, respectively, as expected. Investment
revenue increased 17 percent in 2006 compared to 2005, primarily due to higher average
30