MoneyGram 2006 Annual Report Download - page 90
Download and view the complete annual report
Please find page 90 of the 2006 MoneyGram annual report below. You can navigate through the pages in the report by either clicking on the pages listed below, or by using the keyword search tool below to find specific information within the annual report.-
 1
1 -
2
-
3
-
4
-
5
-
6
-
7
-
8
-
9
-
10
-
11
-
12
-
13
-
14
-
15
-
16
-
17
-
18
-
19
-
20
-
21
-
22
-
23
-
24
-
25
-
26
-
27
-
28
-
29
-
30
-
31
-
32
-
33
-
34
-
35
-
36
-
37
-
38
-
39
-
40
-
41
-
42
-
43
-
44
-
45
-
46
-
47
-
48
-
49
-
50
-
51
-
52
-
53
-
54
-
55
-
56
-
57
-
58
-
59
-
60
-
61
-
62
-
63
-
64
-
65
-
66
-
67
-
68
-
69
-
70
-
71
-
72
-
73
-
74
-
75
-
76
-
77
-
78
-
79
-
 80
80 -
 81
81 -
 82
82 -
 83
83 -
 84
84 -
 85
85 -
 86
86 -
 87
87 -
 88
88 -
 89
89 -
 90
90 -
 91
91 -
 92
92 -
 93
93 -
 94
94 -
 95
95 -
 96
96 -
 97
97 -
 98
98 -
 99
99 -
 100
100 -
101
-
102
-
103
-
104
-
105
-
106
-
107
-
108
 |
 |

Table of Contents
MONEYGRAM INTERNATIONAL, INC. AND SUBSIDIARIES
NOTES TO CONSOLIDATED FINANCIAL STATEMENTS — (Continued)
current period service cost. Subsidies to be received under the Medicare Act beginning in 2007 are not expected to be material.
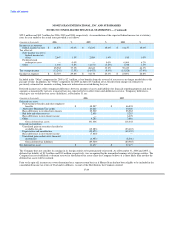
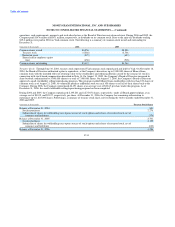
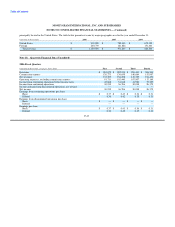
Actuarial Valuation Assumptions — The measurement date for the Company's pension, SERP and postretirement plans is November 30.
Following are the weighted average actuarial assumptions used in calculating the benefit obligation and net benefit cost as of and for the
years ended December 31:
Pension and SERPs Postretirement Benefits
2006 2005 2004 2006 2005 2004
Net periodic benefit cost:
Discount rate 5.90% 6.00% 6.25% 5.90% 6.00% 6.25%
Expected return on plan assets 8.00% 8.50% 8.75% — — —
Rate of compensation increase 5.75% 4.50% 4.50% — — —
Initial healthcare cost trend rate — — — 10.00% 10.00% 10.00%
Ultimate healthcare cost trend rate — — — 5.00% 5.00% 5.00%
Year ultimate healthcare cost trend rate is reached — — — 2013 2013 2010
Projected benefit obligation:
Discount rate 5.70% 5.90% 6.00% 5.70% 5.90% 6.00%
Rate of compensation increase 5.75% 5.75% 4.50% — — —
Initial healthcare cost trend rate — — — 9.50% 10.00% 10.00%
Ultimate healthcare cost trend rate — — — 5.00% 5.00% 5.00%
Year ultimate healthcare cost trend rate is reached — — — 2013 2013 2010
The Company utilizes a building-block approach in determining the long-term expected rate of return on plan assets. Historical markets
are studied and long-term historical relationships between equity securities and fixed income securities are preserved consistent with the
widely accepted capital market principle that assets with higher volatility generate a greater return over the long run. Current market
factors such as inflation and interest rates are evaluated before long-term capital market assumptions are determined. The long-term
portfolio return also takes proper consideration of diversification and rebalancing. Peer data and historical returns are reviewed for
reasonableness and appropriateness.
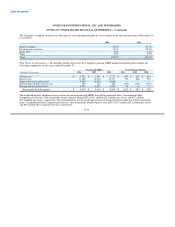
The health care cost trend rate assumption has a significant effect on the amounts reported. A one-percentage point change in assumed
health care trends would have the following effects:
One Percentage One Percentage
(Amounts in thousands) Point Increase Point Decrease
Effect on total of service and interest cost components $ 392 $ (231)
Effect on postretirement benefit obligation 3,441 (2,645)
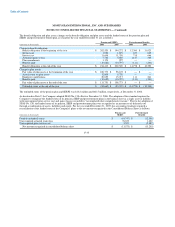
Pension Assets — The Company employs a total return investment approach whereby a mix of equities and fixed income securities are
used to maximize the long-term return of plan assets for a prudent level of risk. Risk tolerance is established through careful
consideration of plan liabilities, plan funded status and corporate financial condition. The investment portfolio contains a diversified
blend of equity and fixed income securities. Furthermore, equity securities are diversified across U.S. and non-U.S. stocks, as well as
growth, value and small and large capitalizations. Other assets such as real estate and cash are used judiciously to enhance long-term
returns while improving portfolio diversification. The Company strives to maintain equity and fixed income securities allocation mix of
approximately 60 percent and 40 percent, respectively. Investment risk is measured and monitored on an ongoing basis through quarterly
investment portfolio reviews and annual liability measurements.
F-33