MoneyGram 2006 Annual Report Download - page 30
Download and view the complete annual report
Please find page 30 of the 2006 MoneyGram annual report below. You can navigate through the pages in the report by either clicking on the pages listed below, or by using the keyword search tool below to find specific information within the annual report.-
 1
1 -
2
-
3
-
4
-
5
-
6
-
7
-
8
-
9
-
10
-
11
-
12
-
13
-
14
-
15
-
16
-
17
-
18
-
19
-
 20
20 -
 21
21 -
 22
22 -
 23
23 -
 24
24 -
 25
25 -
 26
26 -
 27
27 -
 28
28 -
 29
29 -
 30
30 -
 31
31 -
 32
32 -
 33
33 -
 34
34 -
 35
35 -
 36
36 -
 37
37 -
 38
38 -
 39
39 -
 40
40 -
41
-
42
-
43
-
44
-
45
-
46
-
47
-
48
-
49
-
50
-
51
-
52
-
53
-
54
-
55
-
56
-
57
-
58
-
59
-
60
-
61
-
62
-
63
-
64
-
65
-
66
-
67
-
68
-
69
-
70
-
71
-
72
-
73
-
74
-
75
-
76
-
77
-
78
-
79
-
80
-
81
-
82
-
83
-
84
-
85
-
86
-
87
-
88
-
89
-
90
-
91
-
92
-
93
-
94
-
95
-
96
-
97
-
98
-
99
-
100
-
101
-
102
-
103
-
104
-
105
-
106
-
107
-
108
 |
 |
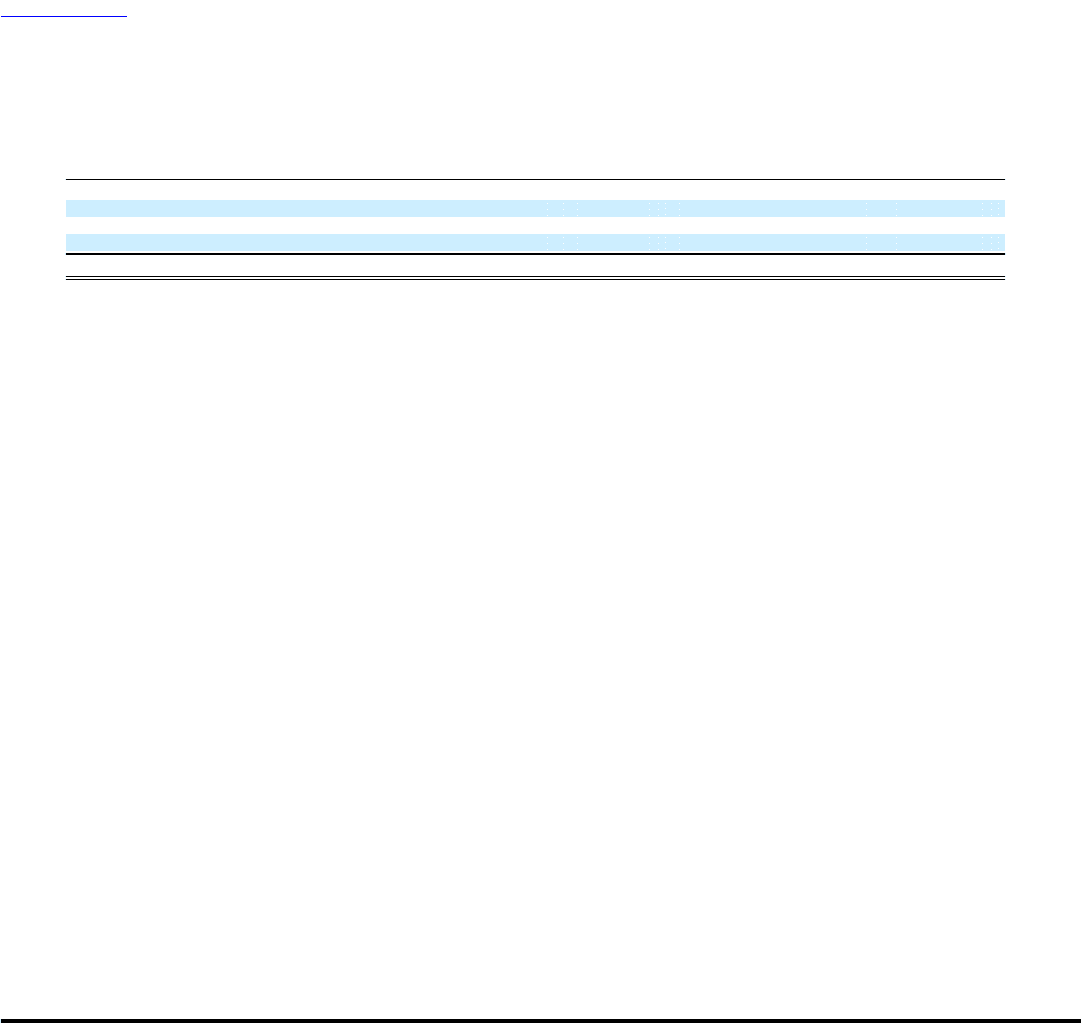
Table of Contents
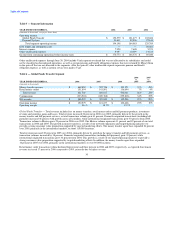
points. The 2006 and 2005 margins benefited from the investment revenue items discussed above, as well as the lower swap costs.
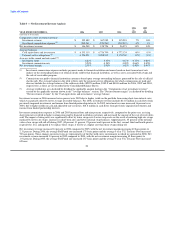
Table 4 — Summary of Gains, Losses and Impairments
2006 2005
vs. vs.
YEAR ENDED DECEMBER 31, 2006 2005 2004 2005 2004
(Amounts in thousands)
Gross realized gains $ 5,080 $ 7,378 $ 31,903 $ (2,298) $ (24,525)
Gross realized losses (2,653) (4,535) (6,364) 1,882 1,829
Other-than-temporary impairments (5,238) (6,552) (15,932) 1,314 9,380
Net securities (losses) gains $ (2,811) $ (3,709) $ 9,607 $ 898 $ (13,316)
As shown in Table 4, the Company had a net securities loss of $2.8 million in 2006 compared to a net securities loss of $3.7 million in
2005, primarily due to lower realized losses and lower impairments. Impairments in 2006 related to investments backed by automobile,
aircraft, manufactured housing, bank loans and insurance securities collateral. The Company had net securities losses of $3.7 million in
2005 compared to a net securities gain of $9.6 million in 2004 despite lower impairments. Net securities gains in 2004 included a large
gain from the early pay off of a security held in the investment portfolio. Impairments in 2005 and 2004 related primarily to investments
backed by aircraft and manufactured housing collateral.
Expenses
Expenses represent operating expenses other than commissions. As MoneyGram is the accounting successor to Viad, expenses through
June 30, 2004 also include corporate overhead that Viad did not allocate to its subsidiaries and, consequently, cannot be classified as
discontinued operations. Included in the first six months of 2004 are approximately $10.2 million of expenses allocated from Viad that
did not recur in 2005. As part of our 2004 spin-off from Viad, we entered into an Interim Services Agreement which provided for
services to be provided by Viad on an interim basis. We were obligated under this Interim Services Agreement to pay approximately
$1.6 million annually, or $0.4 million quarterly, beginning July 1, 2004. We terminated certain services under the Interim Services
Agreement effective on September 28, 2005 and terminated substantially all remaining services effective in the second quarter of 2006.
As a result of this termination, our payments to Viad were $0.3 for the twelve months ended December 31, 2006. Following is a
discussion of the operating expenses presented in Table 1.
Compensation and benefits — Compensation and benefits includes salaries and benefits, management incentive programs, severance
costs and other employee related costs. Compensation and benefits increased 30 percent in 2006 compared to 2005, primarily driven by
the hiring of additional personnel, higher incentive accruals and stock based compensation expense. In 2006, the number of employees
increased by 21 percent over 2005 to drive and support money transfer growth.
Compensation and benefits increased five percent in 2005 compared to 2004, primarily driven by the hiring of additional personnel, stock
option expense and higher incentive accruals, partially offset by the absence of Viad allocations.
Transaction and operations support — Transaction and operations support expenses include marketing costs, professional fees and other
outside services costs, telecommunications and forms expense related to our products. Transaction and operations support costs were up
nine percent in 2006 over 2005, primarily driven by a 39 percent increase in marketing expenditures as we continue to invest in our brand
and support our agent growth and a 26 percent increase in professional fees to support enhancements to our technology systems. These
increases were partially offset by a decrease in provision for agent loss as there was an additional provision for uncollectible agent
receivables of $6.7 million in 2005. In addition, in 2006, we recognized an impairment of $0.9 million due to the discontinuation of a
software development project.
Transactions and operations support costs increased 24 percent in 2005 compared to 2004, primarily driven by marketing expenditures,
higher transaction volumes, use of professional services, legal matters and increased provisions for uncollectible agent receivables,
partially offset by the absence of Viad allocations. Marketing expenditures increased just over 50 percent from 2004 as we invested in our
money transfer brand recognition. In
27