MoneyGram 2006 Annual Report Download - page 42
Download and view the complete annual report
Please find page 42 of the 2006 MoneyGram annual report below. You can navigate through the pages in the report by either clicking on the pages listed below, or by using the keyword search tool below to find specific information within the annual report.-
 1
1 -
2
-
3
-
4
-
5
-
6
-
7
-
8
-
9
-
10
-
11
-
12
-
13
-
14
-
15
-
16
-
17
-
18
-
19
-
20
-
21
-
22
-
23
-
24
-
25
-
26
-
27
-
28
-
29
-
30
-
31
-
 32
32 -
 33
33 -
 34
34 -
 35
35 -
 36
36 -
 37
37 -
 38
38 -
 39
39 -
 40
40 -
 41
41 -
 42
42 -
 43
43 -
 44
44 -
 45
45 -
 46
46 -
 47
47 -
 48
48 -
 49
49 -
 50
50 -
 51
51 -
 52
52 -
53
-
54
-
55
-
56
-
57
-
58
-
59
-
60
-
61
-
62
-
63
-
64
-
65
-
66
-
67
-
68
-
69
-
70
-
71
-
72
-
73
-
74
-
75
-
76
-
77
-
78
-
79
-
80
-
81
-
82
-
83
-
84
-
85
-
86
-
87
-
88
-
89
-
90
-
91
-
92
-
93
-
94
-
95
-
96
-
97
-
98
-
99
-
100
-
101
-
102
-
103
-
104
-
105
-
106
-
107
-
108
 |
 |

Table of Contents
changes in rates. We use a wide range of risk measures and analyses to manage the exposure, including on-going business risk measures
and analyses, run-off measures of the existing portfolio and stress test scenarios. The two main evaluators used by the Company are net
income at risk and duration gap. Net income at risk is measured using a static and forecasted portfolio under various interest rate shock
environments. Duration gap is the estimated gap between our assets and liabilities and summarizes the extent that estimated cash flows
are matched over time across various interest rate environments. The third element to our strategy is setting parameters for risk measures
to help attain corporate margin objectives. Management develops actions based upon a number of factors that include both net investment
revenue at risk and duration gap, as well as current market conditions. Internal indicators are used to determine when the risk profile of
our assets should be re-examined. As the risk measures begin to move beyond our internal indicators, we consider actions to bring them
into the preferred ranges, with an emphasis on time horizon and earnings objectives.
The Company uses derivatives as an important tool in managing interest rate risk. Derivatives are used by the Company as a hedging
tool; we do not enter into speculative trading positions. The Company typically uses interest rate swaps to hedge interest rate risk on its
variable rate commission payments to financial institution customers in its Payment Systems segment. Through these interest rate swaps,
the Company can effectively convert our variable rate commission payments to a fixed rate payment.
The Company uses Value-at-Risk ("VAR") modeling and net investment revenue simulation analysis for measuring and analyzing
consolidated interest rate risk. The Company has previously disclosed the impact to the market value of equity using a "shock" analysis as
market value is measured at a point in time. The "shock" analysis assumes an immediate and sustained change to the yield curve. Due to
limitations in the "shock" analysis, including the assumption that interest rates fluctuate in a parallel shift across the yield curve, the
Company adopted VAR as a methodology for evaluating interest rate risk.
VAR is a risk assessment methodology that estimates the potential decline in the value of a security or portfolio under various market
conditions. VAR quantifies the change in market value due to changes in volatility and interest rates over a given time horizon, and given
a certain level of confidence. The Company utilizes VAR to quantify the potential decline in the fair value of its investment portfolio
using a 95% confidence level and a one-month time horizon. The Company uses a Monte Carlo model that derives the interest rate
change from volatility assumptions, specified probability and time horizon. The model includes the Company's investment portfolio and
interest rate derivative contracts.
At December 31, 2006, the VAR is $(0.4) million, given a 95% confidence level and a one-month time horizon. Accordingly, there is a
5 percent chance the loss on the investment portfolio over the next month will exceed the $(0.4) million. The high, low and average
VARs in 2006 were $(17.6) million, $2.3 million and $(8.2) million, respectively.
The net investment revenue simulation analysis incorporates substantially all of the Company's interest sensitive assets and liabilities,
together with forecasted changes in the balance sheet and assumptions that reflect the current interest rate environment. This analysis
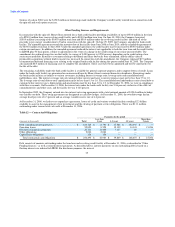
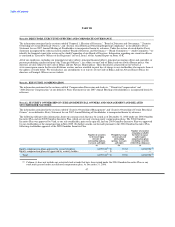
assumes the yield curve increases gradually over a one-year period. Table 13 summarizes the changes to our pre-tax income from
continuing operations under various scenarios.
The modeling of our investment portfolio involves a number of assumptions including prepayments, interest rates and volatility. The
VAR model and net investment revenue simulation analysis are risk analysis tools and do not purport to represent actual losses that will
be incurred by the Company. While we believe that these assumptions are reasonable, different assumptions could produce materially
different estimates.
Table 13 — Interest Rate Sensitivity Analysis
Basis Point Change in Interest Rates
Down Down Down Up Up Up
(Amounts in thousands) 200 100 50 50 100 200
Pre-tax income from continuing operations $ 1,990 $ 990 $ (546) $ (2,094) $ (4,741) $ (8,918)
Percent change 1.4% 0.7% (0.4)% (1.5)% (3.4)% (6.4)%
39