Konica Minolta 2014 Annual Report Download - page 76
Download and view the complete annual report
Please find page 76 of the 2014 Konica Minolta annual report below. You can navigate through the pages in the report by either clicking on the pages listed below, or by using the keyword search tool below to find specific information within the annual report.-
 1
1 -
2
-
3
-
4
-
5
-
6
-
7
-
8
-
9
-
10
-
11
-
12
-
13
-
14
-
15
-
16
-
17
-
18
-
19
-
20
-
21
-
22
-
23
-
24
-
25
-
26
-
27
-
28
-
29
-
30
-
31
-
32
-
33
-
34
-
35
-
36
-
37
-
38
-
39
-
40
-
41
-
42
-
43
-
44
-
45
-
46
-
47
-
48
-
49
-
50
-
51
-
52
-
53
-
54
-
55
-
56
-
57
-
58
-
59
-
60
-
61
-
62
-
63
-
64
-
65
-
 66
66 -
 67
67 -
 68
68 -
 69
69 -
 70
70 -
 71
71 -
 72
72 -
 73
73 -
 74
74 -
 75
75 -
 76
76 -
 77
77 -
 78
78 -
 79
79 -
 80
80 -
 81
81
 |
 |
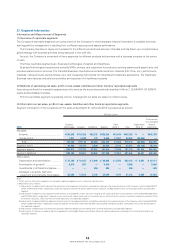
Millions of yen
2013
Business
Technologies Industrial Healthcare Subtotal
Other
(Note 1) Total
Adjustments
(Note 2)
Total amounts
in consolidated
fi nancial
statements
Net sales
External ...................................................
¥581,639 ¥146,792 ¥72,753 ¥801,184 ¥11,889 ¥813,073 ¥ — ¥813,073
Intersegment ..........................................
1,936 2,436 2,652 7,026 52,303 59,330 (59,330) —
Total .....................................................
583,576 149,229 75,406 808,211 64,192 872,404 (59,330) 813,073
Segment profi t ............................................
31,658 23,667 3,348 58,675 4,475 63,151 (22,491) 40,659
Segment assets ..........................................
465,389 150,007 66,081 681,479 51,590 733,069 207,484 940,553
Segment liabilities ......................................
239,068 83,172 41,933 364,174 22,275 386,449 87,688 474,136
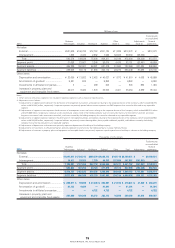
Other items
Depreciation and amortization ................
¥ 23,650 ¥ 13,933 ¥ 2,453 ¥ 40,037 ¥ 1,873 ¥ 41,910 ¥ 4,088 ¥ 45,999
Amortization of goodwill ........................
9,281 582 — 9,863 — 9,863 — 9,863
Investments in affi liated companies .......
3 — 499 503 — 503 990 1,494
Increases in property, plant and
equipment and intangible fi xed assets
...
22,017 9,465 1,570 33,053 2,401 35,454 2,989 38,444
Notes:
1. ‘Other’ consists of business segments not included in reporting segments such as Industrial Inkjet Business.
2. Adjustments are as follows:
(1) Adjustments of segment profi t represent the elimination of intersegment transactions and expenses relating to the corporate division of the Company, which totaled ¥(6,091)
million and ¥(16,400) million, respectively. Corporate expenses are primarily general administration expenses and R&D expenses that cannot be allocated to any reportable
segment.
(2) Adjustments of segment assets represent the elimination of intersegment assets and assets relating to the corporate division of the Company, which totaled ¥(63,201) million
and ¥270,685 million, respectively. Corporate assets are primarily surplus funds of the holding company (cash on hand and in banks and short-term investment securities),
long-term investment funds (investment securities), and assets owned by the holding company that cannot be allocated to any reportable segment.
(3) Adjustments of segment liabilities represent the elimination of intersegment liabilities and liabilities relating to the corporate division of the Company, which totaled ¥(32,960)
million and ¥120,648 million, respectively. Corporate liabilities are primarily interest-bearing debts (loans payable and bonds payable), and liabilities owned by the holding
company that cannot be allocated to any reportable segment.
(4) Adjustments of depreciation and amortization primarily represent depreciation of buildings of the holding company
(5) Adjustments of investments in affi liated companies primarily represent investments by the holding company in equity method affi liates.
(6) Adjustments of increases in property, plant and equipment and intangible fi xed assets primarily represent capital expenditure on buildings in relation to the holding company.
Thousands of U.S. dollars
2014
Business
Technologies Industrial Healthcare Subtotal Other Total Adjustments
Total amounts
in consolidated
fi nancial
statements
Net sales
External ...................................................
$7,091,411 $1,128,313 $800,379 $9,020,113 $149,718 $9,169,831 $ — $9,169,831
Intersegment ..........................................
18,471 29,032 1,729 49,252 212,699 261,951 (261,951) —
Total .....................................................
7,109,881 1,157,355 802,118 9,069,365 362,417 9,431,782 (261,951) 9,169,831
Segment profi t ............................................
620,822 147,250 43,723 811,815 36,174 847,989 (283,035) 564,944
Segment assets ..........................................
5,410,727 1,163,622 670,336 7,244,695 364,448 7,609,153 1,777,361 9,386,514
Segment liabilities ......................................
2,877,915 608,249 475,729 3,961,902 134,114 4,096,026 626,127 4,722,163
Other items
Depreciation and amortization ................
$ 269,977 $ 99,699 $ 27,206 $ 396,891 $ 21,910 $ 418,801 $ 41,459 $ 460,270
Amortization of goodwill ........................
81,753 9,629 — 91,391 — 91,391 — 91,391
Investments in affi liated companies .......
— — 4,722 4,722 — 4,722 — 4,722
Increases in property, plant and
equipment and intangible fi xed assets
...
227,206 129,246 26,312 382,773 16,586 399,368 61,018 460,387
75
KONICA MINOLTA, INC. Annual Report 2014