Konica Minolta 2014 Annual Report Download - page 44
Download and view the complete annual report
Please find page 44 of the 2014 Konica Minolta annual report below. You can navigate through the pages in the report by either clicking on the pages listed below, or by using the keyword search tool below to find specific information within the annual report.-
 1
1 -
2
-
3
-
4
-
5
-
6
-
7
-
8
-
9
-
10
-
11
-
12
-
13
-
14
-
15
-
16
-
17
-
18
-
19
-
20
-
21
-
22
-
23
-
24
-
25
-
26
-
27
-
28
-
29
-
30
-
31
-
32
-
33
-
 34
34 -
 35
35 -
 36
36 -
 37
37 -
 38
38 -
 39
39 -
 40
40 -
 41
41 -
 42
42 -
 43
43 -
 44
44 -
 45
45 -
 46
46 -
 47
47 -
 48
48 -
 49
49 -
 50
50 -
 51
51 -
 52
52 -
 53
53 -
 54
54 -
55
-
56
-
57
-
58
-
59
-
60
-
61
-
62
-
63
-
64
-
65
-
66
-
67
-
68
-
69
-
70
-
71
-
72
-
73
-
74
-
75
-
76
-
77
-
78
-
79
-
80
-
81
 |
 |

43
KONICA MINOLTA, INC. Annual Report 2014
Financial Review and Data
Management’s Discussion and Analysis
Industrial Business
In the display materials field, sales volumes of plain TAC films for LCD
polarizers and VA-TAC films for increasing the viewing angle both
decreased compared with the previous fiscal year due to deteriora-
tion in the market for notebook PCs, adjustments to inventories of
components and materials used for TVs and diversification.
In the measuring instruments field, the acquisition of Instrument Systems
Healthcare Business
In the Healthcare Business, sales of the cassette-type digital radiogra-
phy system AeroDR remained solid with sales volume growth in Japan
and the United States and a steady increase in completed deliveries to
large-scale medical institutions. We have gradually increased the num-
ber of projects we are engaged in based on the collaboration we have
been promoting with leading sales partners in Europe and the United
States. Sales of film products in emerging countries grew, with overall
sales surpassing those of the previous fiscal year.
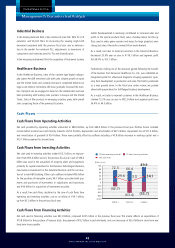
Cash Flows from Investing Activities
Net cash used in investing activities totaled ¥55.7 billion, an improve-
ment from ¥63.4 billion used in the previous fiscal year. Cash of ¥36.4
billion was used in the acquisition of property, plant and equipment,
primarily for capital investment in the Business Technologies Business,
new business investments in the Industrial Business and the construc-
tion of a new R&D building. Other cash outflows included ¥8.6 billion
for the purchase of intangible assets, ¥6.1 billion associated with pay-
ments and purchases of investments in subsidiaries and businesses,
and ¥4.9 billion for acquisition of investment securities.
As a result, free cash flow, calculated as the sum of cash flows from
operating and investing activities, rose to an inflow of ¥34.1 billion,
up from ¥3.0 billion in the previous fiscal year.
GmbH (headquartered in Germany) contributed to increased sales and
profit. In the optical products field, sales of pickup lenses for Blu-ray
Discs used in video game consoles and lenses for large projectors were
strong, but sales of lenses for cameras fell on weak demand.
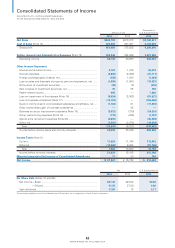
As a result, net sales to external customers in the Industrial Business
decreased 20.9% year on year to ¥116.1 billion and segment profit
fell 36.0% to ¥15.1 billion.
Furthermore, making use of the resources gained following the transfer
of the business from Panasonic Healthcare Co., Ltd., we established an
integrated system for ultrasound diagnostic imaging equipment, span-
ning from development to production and sales. This field is positioned
as a new growth driver. In the fiscal year under review, we pushed
ahead with preparations for full-fledged business development.
As a result, net sales to external customers in the Healthcare Business
climbed 13.2% year on year to ¥82.3 billion and segment profit rose
34.4% to ¥4.5 billion.
Cash Flows
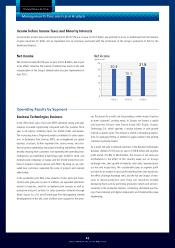
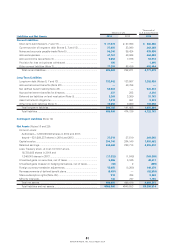
Cash Flows from Operating Activities
Net cash provided by operating activities amounted to ¥89.9 billion, up from ¥66.4 billion in the previous fiscal year. Positive factors included
income before income taxes and minority interests of ¥23.5 billion, depreciation and amortization of ¥47.3 billion, impairment loss of ¥17.4 billion,
and amortization of goodwill of ¥9.4 billion. These were partially offset by outflows including a ¥0.8 billion decrease in working capital and a
¥13.7 billion payment for income taxes.
Cash Flows from Financing Activities
Net cash used in financing activities was ¥61.9 billion, compared ¥24.5 billion in the previous fiscal year. This mainly reflects an expenditure of
¥15.8 billion for the purchase of treasury stock, the payment of ¥9.2 billion in cash dividends, and a net decrease of ¥33.4 billion in short-term and
long-term loans payable.
FY2013FY2012FY2011
(Billions of yen)
(55.7)
89.9
34.1
(63.4)
66.4
(42.7)
29.6 3.0
72.3
-(100)
0
(40)
(60)
(80)
(20)
20
40
80
60
100
CF from operating activities CF from investing activities
Free cash flow