Konica Minolta 2014 Annual Report Download - page 16
Download and view the complete annual report
Please find page 16 of the 2014 Konica Minolta annual report below. You can navigate through the pages in the report by either clicking on the pages listed below, or by using the keyword search tool below to find specific information within the annual report.-
 1
1 -
2
-
3
-
4
-
5
-
 6
6 -
 7
7 -
 8
8 -
 9
9 -
 10
10 -
 11
11 -
 12
12 -
 13
13 -
 14
14 -
 15
15 -
 16
16 -
 17
17 -
 18
18 -
 19
19 -
 20
20 -
 21
21 -
 22
22 -
 23
23 -
 24
24 -
 25
25 -
 26
26 -
27
-
28
-
29
-
30
-
31
-
32
-
33
-
34
-
35
-
36
-
37
-
38
-
39
-
40
-
41
-
42
-
43
-
44
-
45
-
46
-
47
-
48
-
49
-
50
-
51
-
52
-
53
-
54
-
55
-
56
-
57
-
58
-
59
-
60
-
61
-
62
-
63
-
64
-
65
-
66
-
67
-
68
-
69
-
70
-
71
-
72
-
73
-
74
-
75
-
76
-
77
-
78
-
79
-
80
-
81
 |
 |

15
KONICA MINOLTA, INC. Annual Report 2014
ReviewofOperations/Strategy
Business Technologies Business (Office Field)
Sales volume of A3 multi-functional peripherals (MFPs) grew 4% year on year, within
which color MFPs grew 10%. Strong sales of color MFPs continued, with significantly
increased sales volumes compared with the previous fiscal year in all regions, includ-
ing Japan, the United States and Europe. At the same time, the increasing share of
high-end models, such as 40 ppm3 and faster medium- and high-speed devices, which
grew 15%, contributed to profit growth. Monochrome equipment was buoyed by
new products, and, despite the shrinking market, secured sales for the year on par
with those of the previous year.
In OPS, we strengthened our global business structure, further expanded the service
menu, and reinforced business-generating and proposal-making capabilities. As a
result, the number of OPS customers grew steadily, sales jumped 55% year on year to
¥45.4 billion, and we successfully expanded the operating base of this business.
In global major accounts (GMA4), we strengthened our abilities to win accounts in the
Asia-Pacific region, adding to our strength in Europe, resulting in a 41% year-on-year
increase in sales.
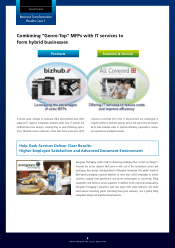
Furthermore, we established a hybrid-type sales model for small- and medium-sized
companies in Europe and the United States that combines IT business solution servic-
es with MFPs and reinforced our proposal capabilities for improving customers’ work
processes. By doing so, we cultivated new customers, expanded the scale of projects
with individual customers and realized higher added value.
1. VE (Value Engineering) : A systematic approach to increasing value by understanding the relationship between
value, the functions that provide it, and the cost of those functions
2. OPS (Optimized Print Services) : Services that optimize customers’ print environment (output and document
management environment) to reduce costs and increase efficiency
3. ppm (Pages Per Minute) : The number of pages a device can output in one minute
4. GMA (Global Major Account) : Large, global-scale corporate customers (and our businesses targeting them)
Business Technologies Business Summary
Net sales to external customers in the Business Technologies Business climbed 26% year on year to ¥729.8 billion and operating income reached
¥63.8 billion, double that of the previous fiscal year. The increase in net sales was attributable to the effect of the steadily weak yen on foreign
exchange rates, sales growth of mainstay color units, improved product mix and acquisitions. The considerable jump in segment profit was due to
an increase in gross profit resulting from sales expansion, the effect of foreign exchange rates, and the full year impact of measures to reduce pro-
duction costs. These cost reductions included decreasing fixed costs by promoting production reform and unit procurement in the production divi-
sion, conducting centralized purchasing of raw materials and digital components, and implementing value engineering.1
Profit supported by growth in color units, especially
high-end units, and steady increase in OPS2 customers
1. Fiscal 2013 Results
Non-hardware sales growth
(excl. currency exchange rate effects)
A3 MFP volume sales growth
Sales growth by region (excl. currency exchange rate effects)
106100
FY2013FY2012
17
13
8987
Existing
New areas +35%
+1%
104100
54
55
50
45
(1%)
+10%
*Base index: FY2012=100
color
Mono-
chrome
FY2013FY2012
Japan
+1%
U.S.
+1%
Europe
+7%
China
+6%
Overall
+4%