Konica Minolta 2014 Annual Report Download - page 45
Download and view the complete annual report
Please find page 45 of the 2014 Konica Minolta annual report below. You can navigate through the pages in the report by either clicking on the pages listed below, or by using the keyword search tool below to find specific information within the annual report.-
 1
1 -
2
-
3
-
4
-
5
-
6
-
7
-
8
-
9
-
10
-
11
-
12
-
13
-
14
-
15
-
16
-
17
-
18
-
19
-
20
-
21
-
22
-
23
-
24
-
25
-
26
-
27
-
28
-
29
-
30
-
31
-
32
-
33
-
34
-
 35
35 -
 36
36 -
 37
37 -
 38
38 -
 39
39 -
 40
40 -
 41
41 -
 42
42 -
 43
43 -
 44
44 -
 45
45 -
 46
46 -
 47
47 -
 48
48 -
 49
49 -
 50
50 -
 51
51 -
 52
52 -
 53
53 -
 54
54 -
 55
55 -
56
-
57
-
58
-
59
-
60
-
61
-
62
-
63
-
64
-
65
-
66
-
67
-
68
-
69
-
70
-
71
-
72
-
73
-
74
-
75
-
76
-
77
-
78
-
79
-
80
-
81
 |
 |
44
KONICA MINOLTA, INC. Annual Report 2014
Financial Review and Data
Management’s Discussion and Analysis
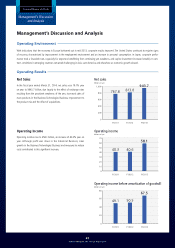
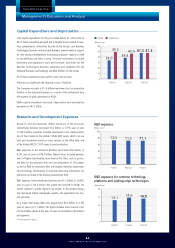
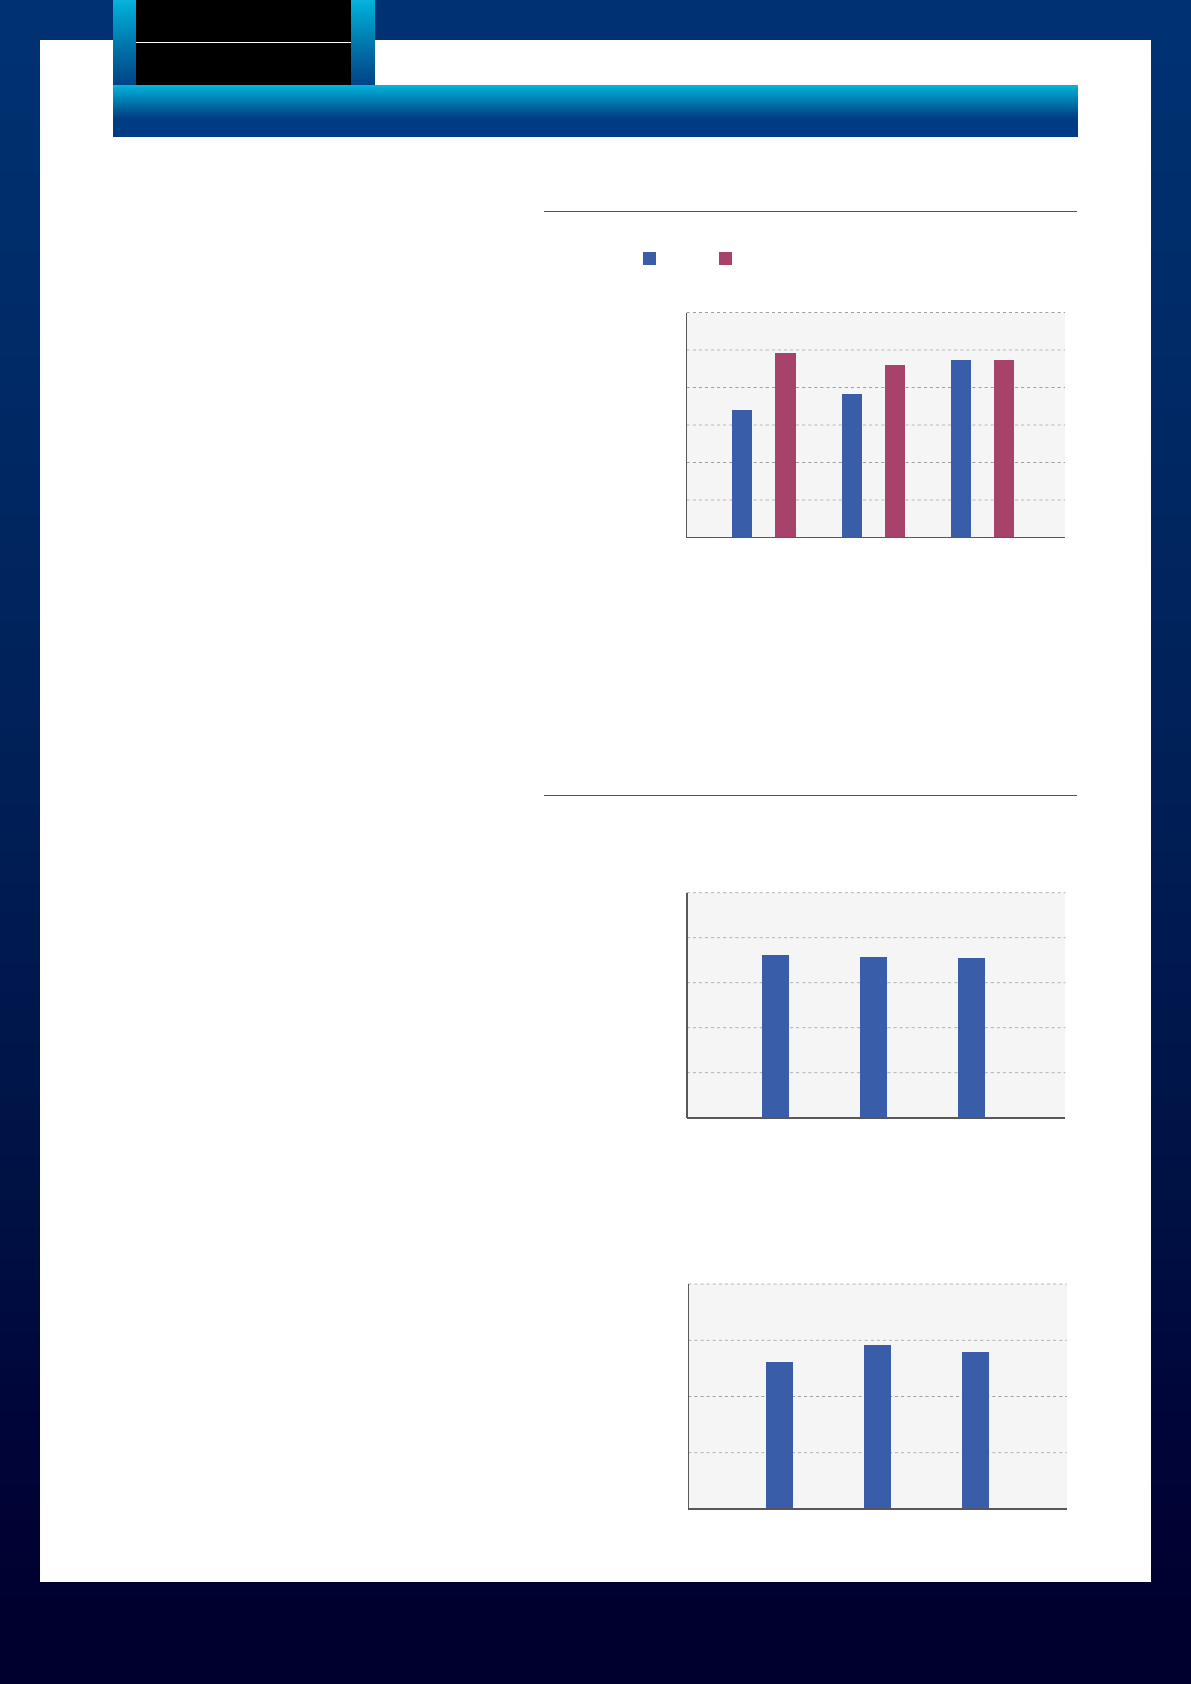
Total capital expenditure for the year ended March 31, 2014 came to
¥47.3 billion (excluding goodwill and intangible assets related to busi-
ness combinations). Investment focused on the Group’s core Business
Technologies Business and Industrial Business, aimed mainly at support
for new product development, increasing production capacity as well
as streamlining and labor saving. Principal investments included
machinery and equipment, tools and furniture, and molds for the
Business Technologies Business, machinery and equipment for the
Industrial Business, and buildings and R&D facilities for the Group.
All of these investments were paid for with cash on hand.
There was no significant sale, disposal or loss of facilities.
The Company recorded a ¥11.9 billion impairment loss on production
facilities in the Industrial Business as a result of the withdrawal from
the business of glass substrates for HDDs.
While capital investment increased, depreciation and amortization
amounted to ¥47.3 billion.
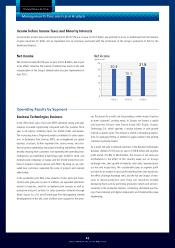
Research and development (R&D) expenses in the Business
Technologies Business decreased ¥0.2 billion, or 0.7%, year on year
to ¥39.0 billion. Expenses included development and commercializa-
tion of five models in the bizhub C554e MFP series, which can use
data and documents stored on cloud services, in the office field, and
of the bizhub PRESS C1070 series in print production.
R&D expenses in the Industrial Business decreased ¥0.6 billion, or
4.2%, year on year to ¥14.0 billion. Major factors included develop-
ment of higher functionality, more diverse TAC films, such as protec-
tive films for the polarizers that are core components of LCD panels,
as well as R&D for functional films and organic materials using mate-
rials technology. Furthermore, in industrial measuring instruments, we
enhanced our lineup in the display measurement field.
R&D expenses in the Healthcare Business rose ¥1.1 billion, or 39.8%,
year on year to ¥4.0 billion. We added the AeroDR 1012HQ, the
world’s lightest* cassette digital X-ray system, to the product lineup,
and developed digital radiography systems and applications for vari-
ous unit sizes.
As a result, total Group R&D costs edged down ¥0.3 billion, or 0.5%
year on year to ¥71.1 billion. This figure includes basic research costs
of ¥14.0 billion (down 4.0% year on year) not included in the individ-
ual segments.
* At the time of its release
Capital Expenditure and Depreciation
Research and Development Expenses
FY2013FY2012FY2011
(Billions of yen)
47.3 47.3
38.4
45.9
34.0
49.2
0
10
20
30
40
50
60
CAPEX Depreciation
R&D expenses
R&D expenses for common technology
platforms and leading-edge technologies
FY2013FY2012FY2011
(Billions of yen)
71.1
71.5
72.5
0
20
40
80
60
100
FY2013FY2012FY2011
(Billions of yen)
14.0
14.6
13.1
0
5
10
15
20