Konica Minolta 2014 Annual Report Download - page 53
Download and view the complete annual report
Please find page 53 of the 2014 Konica Minolta annual report below. You can navigate through the pages in the report by either clicking on the pages listed below, or by using the keyword search tool below to find specific information within the annual report.-
 1
1 -
2
-
3
-
4
-
5
-
6
-
7
-
8
-
9
-
10
-
11
-
12
-
13
-
14
-
15
-
16
-
17
-
18
-
19
-
20
-
21
-
22
-
23
-
24
-
25
-
26
-
27
-
28
-
29
-
30
-
31
-
32
-
33
-
34
-
35
-
36
-
37
-
38
-
39
-
40
-
41
-
42
-
 43
43 -
 44
44 -
 45
45 -
 46
46 -
 47
47 -
 48
48 -
 49
49 -
 50
50 -
 51
51 -
 52
52 -
 53
53 -
 54
54 -
 55
55 -
 56
56 -
 57
57 -
 58
58 -
 59
59 -
 60
60 -
 61
61 -
 62
62 -
 63
63 -
64
-
65
-
66
-
67
-
68
-
69
-
70
-
71
-
72
-
73
-
74
-
75
-
76
-
77
-
78
-
79
-
80
-
81
 |
 |

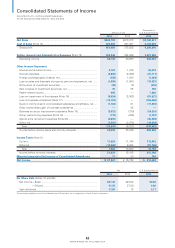
Consolidated Statements of Income
Konica Minolta, Inc. and Consolidated Subsidiaries
For the fi scal years ended March 31, 2014 and 2013
Millions of yen
Thousands of
U.S. dollars (Note 3)
2014 2013 2014
Net Sales ................................................................................................... ¥943,759 ¥813,073 $9,169,831
Cost of Sales (Note 14) ............................................................................. 492,269 437,487 4,783,026
Gross profi t 451,490 375,585 4,386,805
Selling, General and Administrative Expenses (Note 15) ...................... 393,346 334,926 3,821,862
Operating income ................................................................................... 58,144 40,659 564,944
Other Income (Expenses):
Interest and dividend income .................................................................. 2,122 1,476 20,618
Interest expenses ................................................................................... (2,852) (2,499) (27,711)
Foreign exchange gains (losses), net ...................................................... (126) 1,508 (1,224)
Loss on sales and disposals of property, plant and equipment, net ....... (1,999) (1,661) (19,423)
Write-down of investment securities ...................................................... (49) (2) (476)
Gain on sales of investment securities, net ............................................ 75 55 729
Patent-related income ............................................................................. 809 —7,860
Loss on impairment of fi xed assets (Note 16) ........................................ (5,524) (2,902) (53,673)
Loss on business withdrawal (Note 17) .................................................. (16,122) —(156,646)
Equity in income (loss) of unconsolidated subsidiaries and affi liates, net
......
(1,163) 61 (11,300)
Other extraordinary gain of overseas subsidiaries .................................. —95 —
Business structure improvement expenses (Note 18) ........................... (3,532) (379) (34,318)
Group restructuring expenses (Note 19) ................................................. (118) (296) (1,147)
Special extra retirement expenses (Note 20) .......................................... (4,655) —(45,229)
Other, net ................................................................................................ (1,503) (2,278) (14,604)
Total ..................................................................................................... (34,641) (6,823) (336,582)
Income before income taxes and minority interests .............................. 23,503 33,836 228,362
Income Taxes (Note 8):
Current .................................................................................................... 11,624 11,745 112,942
Deferred .................................................................................................. (10,060) 6,934 (97,746)
Total ..................................................................................................... 1,564 18,680 15,196
Income before minority interests ............................................................ 21,939 15,155 213,166
Minority Interests in Net Income of Consolidated Subsidiaries 77 30 748
Net Income ................................................................................................ ¥ 21,861 ¥ 15,124 $ 212,408
Yen U.S. dollars (Note 3)
2014 2013 2014
Per Share Data (Notes 10 and 28):
Net income—Basic ................................................................................. ¥41.38 ¥28.52 $0.40
—Diluted .............................................................................. 41.28 27.86 0.40
Cash dividends ........................................................................................ 17.50 15 0.17
The accompanying Notes to the Consolidated Financial Statements are an integral part of these fi nancial statements.
52
KONICA MINOLTA, INC. Annual Report 2014