Konica Minolta 2014 Annual Report Download - page 20
Download and view the complete annual report
Please find page 20 of the 2014 Konica Minolta annual report below. You can navigate through the pages in the report by either clicking on the pages listed below, or by using the keyword search tool below to find specific information within the annual report.-
 1
1 -
2
-
3
-
4
-
5
-
6
-
7
-
8
-
9
-
 10
10 -
 11
11 -
 12
12 -
 13
13 -
 14
14 -
 15
15 -
 16
16 -
 17
17 -
 18
18 -
 19
19 -
 20
20 -
 21
21 -
 22
22 -
 23
23 -
 24
24 -
 25
25 -
 26
26 -
 27
27 -
 28
28 -
 29
29 -
 30
30 -
31
-
32
-
33
-
34
-
35
-
36
-
37
-
38
-
39
-
40
-
41
-
42
-
43
-
44
-
45
-
46
-
47
-
48
-
49
-
50
-
51
-
52
-
53
-
54
-
55
-
56
-
57
-
58
-
59
-
60
-
61
-
62
-
63
-
64
-
65
-
66
-
67
-
68
-
69
-
70
-
71
-
72
-
73
-
74
-
75
-
76
-
77
-
78
-
79
-
80
-
81
 |
 |

19
KONICA MINOLTA, INC. Annual Report 2014
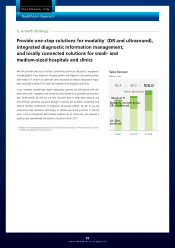
Sales volumes of color and monochrome models saw year-on-year growth of 6% and
7%, respectively. Non-hardware1 sales were supported by emerging signs of a bot-
toming out in printing demand, and sales in existing businesses grew 9%, while sales
in new areas, such as various print-related services, jumped 129%.
The Company also continued initiatives to capture the large-volume printing needs of
major corporate customers. In Japan, we developed unique solutions by combining
the on-demand output2 services of Kinko’s Japan Co., Ltd., acquired in May 2012,
with office unit products and services, strengthening our marketing capabilities tar-
geting large corporations. In Europe, we utilized Charterhouse Print Management
Limited, acquired in the previous fiscal year, to offer a wider selection of production
and print services for sales promotion materials.
Furthermore, we formed a capital and business alliance with France-based MGI
Digital Graphic Technology S.A., which operates a unique business in such growth
markets as plastic cards. This alliance is aimed at developing applications for package
printing, in addition to paper output in the existing commercial printing market.
Providing a wider range of print services through acquired
companies Sales growth in both color and monochrome units
1. Fiscal 2013 Results
Non-hardware sales growth
(excl. currency exchange rate effects)
Production Print sales
134100
FY2013FY2012
47
21
8679
Existing
New areas +129%
+9%
*Base index: FY2012=100
107100
FY2013FY2012
42
39
65
61
+7%
+6%
color
Mono-
chrome
ReviewofOperations/Strategy
Business Technologies Business (Production Print Field)
1. Non-hardware : Sources of income other than hardware, such as toner and other consumables or mainte-
nance and other services. Includes IT services and other services in new domains
2. On-demand output : Means of printing or devices emphasizing instantaneousness, aimed at providing
printing when needed, in just the amounts needed
Sales growth by region (excl. currency exchange rate effects)
Japan
+12%
U.S.
+5%
Europe
+39%
China
+25%
Overall
+21%