Konica Minolta 2014 Annual Report Download - page 46
Download and view the complete annual report
Please find page 46 of the 2014 Konica Minolta annual report below. You can navigate through the pages in the report by either clicking on the pages listed below, or by using the keyword search tool below to find specific information within the annual report.-
 1
1 -
2
-
3
-
4
-
5
-
6
-
7
-
8
-
9
-
10
-
11
-
12
-
13
-
14
-
15
-
16
-
17
-
18
-
19
-
20
-
21
-
22
-
23
-
24
-
25
-
26
-
27
-
28
-
29
-
30
-
31
-
32
-
33
-
34
-
35
-
 36
36 -
 37
37 -
 38
38 -
 39
39 -
 40
40 -
 41
41 -
 42
42 -
 43
43 -
 44
44 -
 45
45 -
 46
46 -
 47
47 -
 48
48 -
 49
49 -
 50
50 -
 51
51 -
 52
52 -
 53
53 -
 54
54 -
 55
55 -
 56
56 -
57
-
58
-
59
-
60
-
61
-
62
-
63
-
64
-
65
-
66
-
67
-
68
-
69
-
70
-
71
-
72
-
73
-
74
-
75
-
76
-
77
-
78
-
79
-
80
-
81
 |
 |

45
KONICA MINOLTA, INC. Annual Report 2014
Financial Review and Data
Management’s Discussion and Analysis
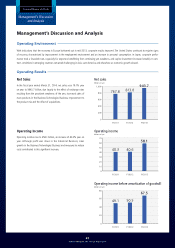
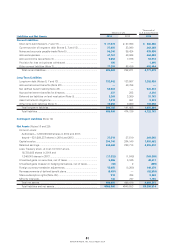
Assets
Total assets at March 31, 2014 were up ¥25.5 billion, or 2.7%, from the
previous fiscal year-end to ¥966.0 billion. Current assets rose ¥9.7 bil-
lion, or 1.7%, to ¥589.3 billion (61.0% of total assets) while fixed assets
rose ¥15.7 billion, or 4.4%, to ¥376.7 billion (39.0% of total assets).
With respect to current assets as of March 31, 2014, cash on hand
and in banks increased ¥2.0 billion from the previous fiscal year-end
to ¥95.4 billion, but short-term investment securities decreased ¥27.5
billion to ¥92.9 billion, and cash and cash equivalents decreased
¥25.4 billion to ¥188.4 billion. Meanwhile, notes and accounts receiv-
able–trade increased ¥26.0 billion to ¥220.1 billion, and lease receiv-
ables and investment assets increased ¥5.2 billion to ¥21.2 billion.
Inventories increased ¥2.7 billion to ¥115.2 billion.
In fixed assets, property, plant and equipment decreased ¥6.5 billion
from the previous fiscal year-end to ¥173.3 billion due primarily to
depreciation linked to the withdrawal from the business of glass sub-
strates for HDDs, despite capital investment in the Business
Technologies Business and Industrial Business as well as the construc-
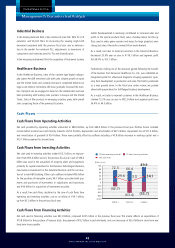
Financial Position and Liquidity
Total assets
FY2013FY2012FY2011
(Billions of yen) 966.0
940.5
902.0
0
200
400
600
800
1,000
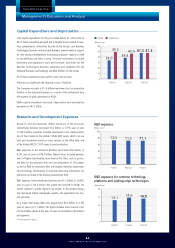
FY2013FY2012FY2011
(Billions of yen) (%)
227.9
231.9
224.8
213.9
196.1
188.5
0
50
100
150
200
250
300
-0.02
0.00
0.02
0.04
0.06
0.08
0.10
-0.01
0.02 0.02
Interest-bearing debt Cash and short-term investment securities
Net debt-equity ratio
Liabilities
Total liabilities increased ¥11.8 billion, or 2.5%, year on year to
¥486.0 billion (equivalent to 50.3% of total assets). Notes and
accounts payable–trade increased ¥10.8 billion to ¥96.2 billion and
accounts payable–other and accrued expenses increased ¥12.8 billion
to ¥74.3 billion. Provision for bonuses increased ¥2.1 billion. Net
defined benefit liability increased ¥9.8 billion due to the application of
accounting standards for retirement benefits. Interest-bearing debt
(total of short-term and long-term debt and bonds) decreased ¥28.7
billion to ¥196.1 billion.
tion of a new R&D building. Intangible fixed assets increased ¥0.4 bil-
lion to ¥111.3 billion.
In investments and other assets, investment securities increased ¥6.0
billion year on year to ¥29.2 billion as of March 31, 2014. Deferred
tax assets increased ¥15.0 billion to ¥48.0 billion due primarily to a
revision of recoverable amount in light of reorganization of the
Group’s administrative structure conducted in April 2013.
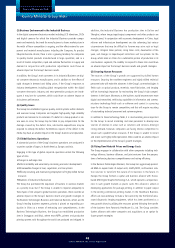
Net Assets
Net assets at March 31, 2014 were up ¥13.6 billion, or 2.9% from a
year earlier to ¥480.0 billion (49.7% of total assets). Retained earn-
ings increased ¥12.7 billion year on year to ¥242.4 billion, reflecting
the ¥21.8 billion in net income for the period and cash dividends paid
of ¥9.2 billion. Furthermore, treasury stock increased ¥15.7 billion due
to repurchases. In accumulated other comprehensive income, foreign
currency translation adjustments rose ¥23.3 billion due mainly to the
continued weakness of the yen, mainly against the U.S. dollar and the
euro, while the Company recorded negative remeasurements of
defined benefit plans of ¥8.4 billion due to the application of
accounting standards for retirement benefits.
Net assets
FY2013FY2012FY2011
(Billions of yen)
480.0
466.4
434.9
0
100
200
300
400
500
600