Konica Minolta 2014 Annual Report Download - page 66
Download and view the complete annual report
Please find page 66 of the 2014 Konica Minolta annual report below. You can navigate through the pages in the report by either clicking on the pages listed below, or by using the keyword search tool below to find specific information within the annual report.-
 1
1 -
2
-
3
-
4
-
5
-
6
-
7
-
8
-
9
-
10
-
11
-
12
-
13
-
14
-
15
-
16
-
17
-
18
-
19
-
20
-
21
-
22
-
23
-
24
-
25
-
26
-
27
-
28
-
29
-
30
-
31
-
32
-
33
-
34
-
35
-
36
-
37
-
38
-
39
-
40
-
41
-
42
-
43
-
44
-
45
-
46
-
47
-
48
-
49
-
50
-
51
-
52
-
53
-
54
-
55
-
 56
56 -
 57
57 -
 58
58 -
 59
59 -
 60
60 -
 61
61 -
 62
62 -
 63
63 -
 64
64 -
 65
65 -
 66
66 -
 67
67 -
 68
68 -
 69
69 -
 70
70 -
 71
71 -
 72
72 -
 73
73 -
 74
74 -
 75
75 -
 76
76 -
77
-
78
-
79
-
80
-
81
 |
 |

thousand) which were approved by the Board of Directors and
paid in May 2014.
The amount available for dividends under the Japanese Cor-
porate Law is based on the amount recorded in the Company’s
nonconsolidated books of account in accordance with account-
ing principles generally accepted in Japan.
On October 31, 2013, the Board of Directors approved cash
dividends to be paid to shareholders of record as of September
30, 2013, totaling ¥5,303 million ($51,525 thousand), at a rate
of ¥10.0 per share. (This includes the ordinary year-end dividend
of ¥7.5 per share and the commemorative dividend of ¥2.5
per share.)
On May 9, 2014, the Board of Directors approved cash
dividends to be paid to shareholders of record as of March 31,
2014, totaling ¥3,862 million ($37,524 thousand), at a rate of
¥7.5 per share.
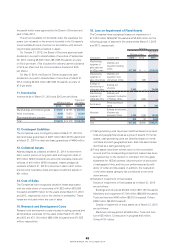
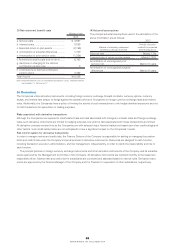
11. Inventories
Inventories as of March 31, 2014 and 2013 are as follows:
Millions of yen
Thousands of
U.S. dollars
2014 2013 2014
Merchandise and fi nished goods
...
¥ 87,807 ¥ 82,788 $ 853,158
Work in process ............................
9,609 10,610 93,364
Raw materials and supplies ..........
17,858 19,080 173,513
Total ..............................................
¥115,275 ¥112,479 $1,120,045
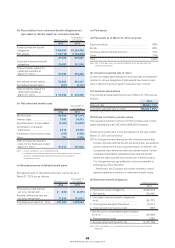
12. Contingent Liabilities
The Companies were contingently liable at March 31, 2014 for
debt and lease guarantees of ¥427 million ($4,149 thousand) and
at March 31, 2013 for debt and lease guarantees of ¥456 million.
13. Collateral Assets
Assets pledged as collateral at March 31, 2014 for short-term
debt, current portion of long-term debt and long-term debt of
¥15 million ($146 thousand) are accounts receivable–trade and
vehicles of ¥16 million ($155 thousand). Assets pledged as
collateral at March 31, 2013 for short-term debt of ¥31 million
are accounts receivable–trade and lease investment assets of
¥31 million.
14. Cost of Sales
The Companies have recognized valuation losses associated
with the write-down of inventories of ¥1,552 million ($15,080
thousand) and ¥979 million for the years ended March 31, 2014
and 2013, respectively, due to the decline in profi tability. These
losses are included within the cost of sales.
15. Research and Development Costs
Research and development costs included in selling, general and
administrative expenses for the years ended March 31, 2014
and 2013 are ¥71,184 million ($691,644 thousand) and ¥71,533
million, respectively.
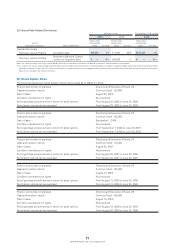
16. Loss on Impairment of Fixed Assets
The Companies have recognized losses on impairment of
¥17,424 million ($169,297 thousand) and ¥2,902 million for the
following groups of assets for the years ended March 31, 2014
and 2013, respectively:
Amount
Millions of yen
Thousands of
U.S. dollars
Description Classifi cation 2014 2013 2014
Manufacturing
equipment of
glass substrates
for HDDs, others
Machinery and
equipment, Buildings,
Others
¥11,899 ¥ — $115,614
Manufacturing
equipment of
glass pickup lenses
Machinery and
equipment, Tools
and furniture, Others
— 365 —
Buildings for
manufacturing of
radiographic fi lms
Buildings and
structures
3,566 — 34,648
Manufacturing
equipment of
radiographic fi lms
Machinery and
equipment, Construction
in Progress, Others
— 1,058 —
Rental assets Rental business-use
assets
25 44 243
Idle assets
Buildings and structures,
Machinery and
equipment, Others
1,699 1,399
16,508
Others —
233 34 2,264
Total
¥17,424 ¥2,902 $169,297
(1) Cash-generating units have been identifi ed based on product
lines and geographical areas as a group of assets. For rental
assets, cash generating units are identifi ed based on rental
contracts and each geographical area. Each idle asset is also
identifi ed as a cash-generating unit.
(2) Fixed assets have been written down to the recoverable
amount and the corresponding impairment losses have been
recognized due to the decision to withdraw from the glass
substrates for HDDs business, discontinuation of production
of radiographic fi lms, and the poor performance and profi t-
ability of rental and idle assets. In addition, the revaluation
of the other assets category has contributed to the write
down amount.
(3) Details of impairment of fi xed assets
Details of impairment of fi xed assets as of March 31, 2014
are as follows:
Buildings and structures ¥9,382 million ($91,158 thousand),
Machinery and equipment ¥7,194 million ($69,899 thousand),
Tools and furniture ¥640 million ($6,218 thousand), Others
¥206 million ($2,002 thousand).
Details of impairment of fi xed assets as of March 31, 2013
are as follows:
Machinery and equipment ¥2,626 million, Tools and furni-
ture ¥125 million, Construction in progress ¥48 million,
Others ¥101 million.
65
KONICA MINOLTA, INC. Annual Report 2014