Konica Minolta 2014 Annual Report Download - page 42
Download and view the complete annual report
Please find page 42 of the 2014 Konica Minolta annual report below. You can navigate through the pages in the report by either clicking on the pages listed below, or by using the keyword search tool below to find specific information within the annual report.-
 1
1 -
2
-
3
-
4
-
5
-
6
-
7
-
8
-
9
-
10
-
11
-
12
-
13
-
14
-
15
-
16
-
17
-
18
-
19
-
20
-
21
-
22
-
23
-
24
-
25
-
26
-
27
-
28
-
29
-
30
-
31
-
 32
32 -
 33
33 -
 34
34 -
 35
35 -
 36
36 -
 37
37 -
 38
38 -
 39
39 -
 40
40 -
 41
41 -
 42
42 -
 43
43 -
 44
44 -
 45
45 -
 46
46 -
 47
47 -
 48
48 -
 49
49 -
 50
50 -
 51
51 -
 52
52 -
53
-
54
-
55
-
56
-
57
-
58
-
59
-
60
-
61
-
62
-
63
-
64
-
65
-
66
-
67
-
68
-
69
-
70
-
71
-
72
-
73
-
74
-
75
-
76
-
77
-
78
-
79
-
80
-
81
 |
 |

41
KONICA MINOLTA, INC. Annual Report 2014
Management’s Discussion and Analysis
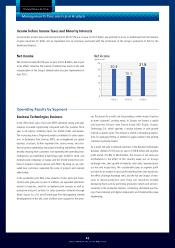
With indications that the economy in Europe bottomed out in mid-2013, corporate results improved. The United States continued to register signs
of recovery, characterized by improvement in the employment environment and an increase in personal consumption. In Japan, corporate perfor-
mance took a favorable turn, especially for exporters benefitting from continuing yen weakness, and capital investment increased steadily. In con-
trast, conditions in emerging countries remained challenging in Asia, Latin America and elsewhere as economic growth slowed.
Operating Environment
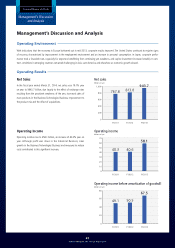
Operating Results
Net Sales
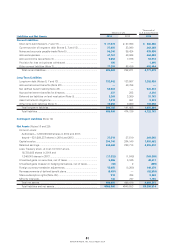
In the fiscal year ended March 31, 2014, net sales rose 16.1% year
on year to ¥943.7 billion, due largely to the effect of exchange rates
resulting from the persistent weakness of the yen, increased sales of
main products in the Business Technologies Business, improvement to
the product mix and the effect of acquisitions.
Operating Income
Operating income rose to ¥58.1 billion, an increase of 43.0% year on
year. Although profit was down in the Industrial Business, sales
growth in the Business Technologies Business and measures to reduce
costs contributed to this significant increase.
Net sales
Operating income
Operating income before amortization of goodwill
FY2013FY2012FY2011
(Billions of yen)
943.7
813.0
767.8
0
200
400
600
800
1,000
40.3
FY2013FY2012FY2011
(Billions of yen)
58.1
40.6
0
10
20
30
40
50
60
70
FY2013FY2012FY2011
(Billions of yen)
67.5
50.5
49.1
0
20
40
60
80
Financial Review and Data
Management’s Discussion
and Analysis