IHOP 2014 Annual Report Download - page 82
Download and view the complete annual report
Please find page 82 of the 2014 IHOP annual report below. You can navigate through the pages in the report by either clicking on the pages listed below, or by using the keyword search tool below to find specific information within the annual report.-
 1
1 -
2
-
3
-
4
-
5
-
6
-
7
-
8
-
9
-
10
-
11
-
12
-
13
-
14
-
15
-
16
-
17
-
18
-
19
-
20
-
21
-
22
-
23
-
24
-
25
-
26
-
27
-
28
-
29
-
30
-
31
-
32
-
33
-
34
-
35
-
36
-
37
-
38
-
39
-
40
-
41
-
42
-
43
-
44
-
45
-
46
-
47
-
48
-
49
-
50
-
51
-
52
-
53
-
54
-
55
-
56
-
57
-
58
-
59
-
60
-
61
-
62
-
63
-
64
-
65
-
66
-
67
-
68
-
69
-
70
-
71
-
 72
72 -
 73
73 -
 74
74 -
 75
75 -
 76
76 -
 77
77 -
 78
78 -
 79
79 -
 80
80 -
 81
81 -
 82
82 -
 83
83 -
 84
84 -
 85
85 -
 86
86 -
 87
87 -
 88
88 -
 89
89 -
 90
90 -
 91
91 -
 92
92 -
93
-
94
-
95
-
96
-
97
-
98
-
99
-
100
-
101
-
102
-
103
-
104
-
105
-
106
-
107
-
108
-
109
-
110
-
111
-
112
-
113
-
114
-
115
-
116
-
117
-
118
-
119
-
120
-
121
-
122
-
123
-
124
-
125
-
126
-
127
-
128
-
129
-
130
-
131
 |
 |

63
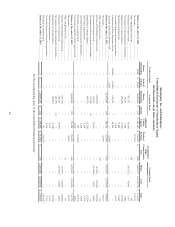
DineEquity, Inc. and Subsidiaries
Consolidated Statements of Comprehensive Income
(In thousands, except per share amounts)
Year Ended December 31,
2014 2013 2012
Segment Revenues:
Franchise and restaurant revenues................................................................ $ 518,579 $ 502,586 $ 712,580
Rental revenues ............................................................................................ 122,932 124,769 122,859
Financing revenues....................................................................................... 13,477 13,112 14,489
Total segment revenues..................................................................................... 654,988 640,467 849,928
Segment Expenses:
Franchise and restaurant expenses ............................................................... 184,411 173,232 359,196
Rental expenses ............................................................................................ 94,637 97,298 97,165
Financing expenses ...................................................................................... 825 245 1,623
Total segment expenses..................................................................................... 279,873 270,775 457,984
Gross segment profit....................................................................................... 375,115 369,692 391,944
General and administrative expenses................................................................ 145,910 143,586 163,215
Interest expense................................................................................................. 96,637 100,264 114,338
Amortization of intangible assets...................................................................... 12,063 12,282 12,293
Closure and impairment charges....................................................................... 3,721 1,812 4,218
Loss on extinguishment of debt ........................................................................ 64,859 58 5,554
Debt modification costs .................................................................................... — 1,296 —
Loss (gain) on disposition of assets .................................................................. 329 (223)(102,597)
Income before income taxes ............................................................................. 51,596 110,617 194,923
Income tax provision......................................................................................... (15,143)(38,580)(67,249)
Net income ....................................................................................................... 36,453 72,037 127,674
Other comprehensive income (loss), net of tax:
Adjustment to unrealized loss on available-for-sale investments ................. 107 — 140
Foreign currency translation adjustment ....................................................... (16)(12) 2
Total comprehensive income.......................................................................... $ 36,544 $ 72,025 $ 127,816
Net income available to common stockholders:
Net income ........................................................................................................ $ 36,453 $ 72,037 $ 127,674
Less: Net income allocated to unvested participating restricted stock ............. (521)(1,200)(2,718)
Less: Accretion of Series B preferred stock...................................................... — — (2,498)
Net income available to common stockholders ................................................ $ 35,932 $ 70,837 $ 122,458
Net income available to common stockholders per share:
Basic .............................................................................................................. $ 1.92 $ 3.75 $ 6.81
Diluted ........................................................................................................... $ 1.90 $ 3.70 $ 6.63
Weighted average shares outstanding:
Basic .............................................................................................................. 18,753 18,871 17,992
Diluted ........................................................................................................... 18,956 19,141 18,877
Dividends declared per common share ......................................................... $ 3.125 $ 3.00 $ —
Dividends paid per common share ................................................................ $ 2.25 $ 3.00 $ —
See the accompanying notes to the consolidated financial statements.