IHOP 2014 Annual Report Download - page 50
Download and view the complete annual report
Please find page 50 of the 2014 IHOP annual report below. You can navigate through the pages in the report by either clicking on the pages listed below, or by using the keyword search tool below to find specific information within the annual report.-
 1
1 -
2
-
3
-
4
-
5
-
6
-
7
-
8
-
9
-
10
-
11
-
12
-
13
-
14
-
15
-
16
-
17
-
18
-
19
-
20
-
21
-
22
-
23
-
24
-
25
-
26
-
27
-
28
-
29
-
30
-
31
-
32
-
33
-
34
-
35
-
36
-
37
-
38
-
39
-
 40
40 -
 41
41 -
 42
42 -
 43
43 -
 44
44 -
 45
45 -
 46
46 -
 47
47 -
 48
48 -
 49
49 -
 50
50 -
 51
51 -
 52
52 -
 53
53 -
 54
54 -
 55
55 -
 56
56 -
 57
57 -
 58
58 -
 59
59 -
 60
60 -
61
-
62
-
63
-
64
-
65
-
66
-
67
-
68
-
69
-
70
-
71
-
72
-
73
-
74
-
75
-
76
-
77
-
78
-
79
-
80
-
81
-
82
-
83
-
84
-
85
-
86
-
87
-
88
-
89
-
90
-
91
-
92
-
93
-
94
-
95
-
96
-
97
-
98
-
99
-
100
-
101
-
102
-
103
-
104
-
105
-
106
-
107
-
108
-
109
-
110
-
111
-
112
-
113
-
114
-
115
-
116
-
117
-
118
-
119
-
120
-
121
-
122
-
123
-
124
-
125
-
126
-
127
-
128
-
129
-
130
-
131
 |
 |
31
Significant Known Events, Trends or Uncertainties Impacting or Expected to Impact Comparisons of Reported or
Future Results
Same-restaurant Sales Trends
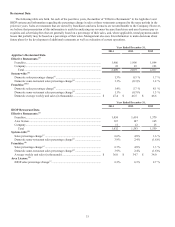
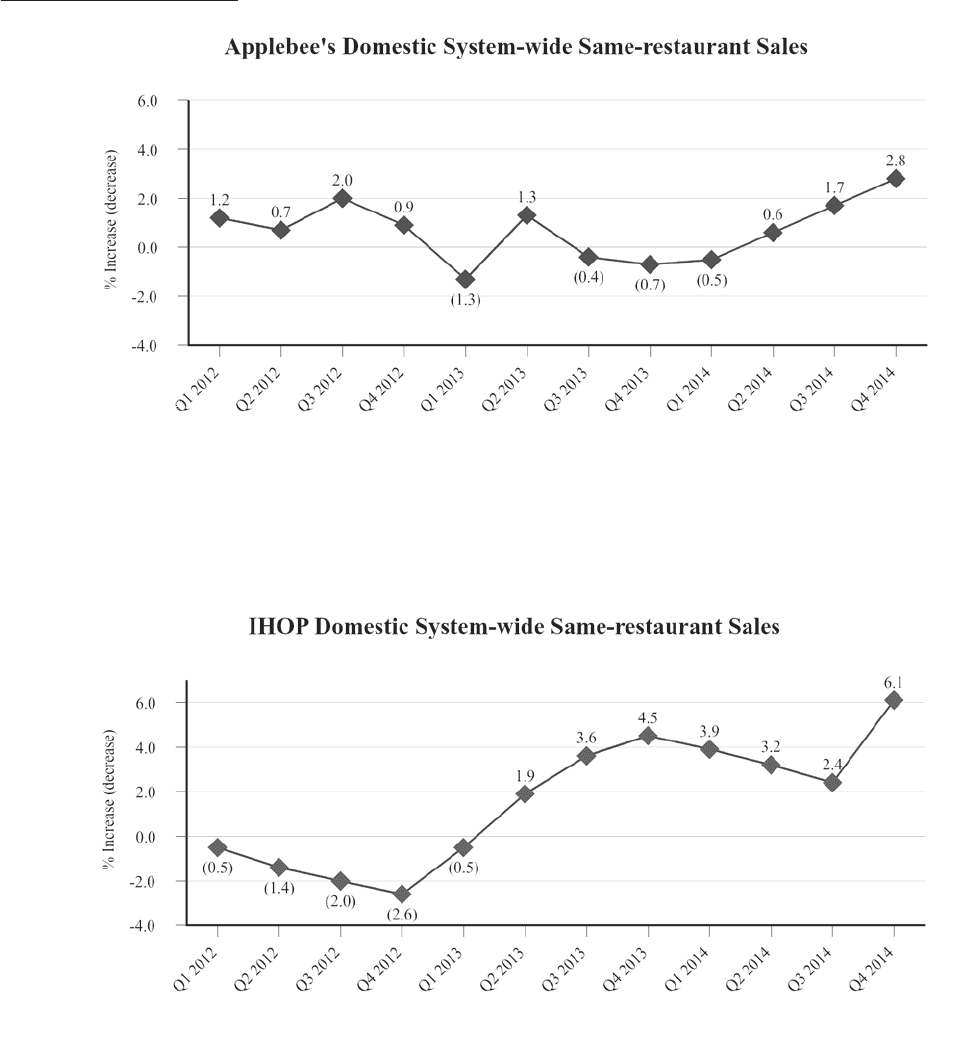
Applebee’s domestic system-wide same-restaurant sales increased 2.8% for the three months ended December 31, 2014
from the same period in 2013. The increase for the fourth quarter was due to an increase in average customer check as well as a
slight increase in customer traffic. For the full year ended December 31, 2014, Applebee’s domestic system-wide same-
restaurant sales increased 1.1%. The increase for the full year 2014 was due to an increase in average customer check partially
offset by a decrease in customer traffic.
IHOP’s domestic system-wide same-restaurant sales increased 6.1% for the three months ended December 31, 2014,
IHOP's highest quarterly increase since the first quarter of 2004. For the full year ended December 31, 2014, IHOP's domestic
system-wide same-restaurant sales increased 3.9%, the highest annual increase since 2004. The increase for both the fourth
quarter and full year 2014 was due to an increase in average customer check as well as an increase in customer traffic.
We believe the increases in our brands' domestic system-wide same-restaurant sales during 2014 resulted from a number of
different factors. These factors include, but are not limited to, an increase in advertising effectiveness, a continuing positive
impact on IHOP domestic system-wide same-restaurant sales from the 2013 redesign of IHOP's menu, and other
macroeconomic factors. There can be no assurance as to how long the positive impact of any of these factors will continue, if at
all.