IHOP 2014 Annual Report Download - page 5
Download and view the complete annual report
Please find page 5 of the 2014 IHOP annual report below. You can navigate through the pages in the report by either clicking on the pages listed below, or by using the keyword search tool below to find specific information within the annual report.-
 1
1 -
 2
2 -
 3
3 -
 4
4 -
 5
5 -
 6
6 -
 7
7 -
 8
8 -
 9
9 -
 10
10 -
 11
11 -
 12
12 -
 13
13 -
 14
14 -
 15
15 -
 16
16 -
17
-
18
-
19
-
20
-
21
-
22
-
23
-
24
-
25
-
26
-
27
-
28
-
29
-
30
-
31
-
32
-
33
-
34
-
35
-
36
-
37
-
38
-
39
-
40
-
41
-
42
-
43
-
44
-
45
-
46
-
47
-
48
-
49
-
50
-
51
-
52
-
53
-
54
-
55
-
56
-
57
-
58
-
59
-
60
-
61
-
62
-
63
-
64
-
65
-
66
-
67
-
68
-
69
-
70
-
71
-
72
-
73
-
74
-
75
-
76
-
77
-
78
-
79
-
80
-
81
-
82
-
83
-
84
-
85
-
86
-
87
-
88
-
89
-
90
-
91
-
92
-
93
-
94
-
95
-
96
-
97
-
98
-
99
-
100
-
101
-
102
-
103
-
104
-
105
-
106
-
107
-
108
-
109
-
110
-
111
-
112
-
113
-
114
-
115
-
116
-
117
-
118
-
119
-
120
-
121
-
122
-
123
-
124
-
125
-
126
-
127
-
128
-
129
-
130
-
131
 |
 |

Julia Stewart
Chairman and Chief Executive Officer,
DineEquity, Inc.
eputat ion
To our DineEquity® Family of Shareholders,
At DineEquity, our brands drive value for the entire
organization. Today, Applebee’s and IHOP are iconic
leaders in their respective categories, and we
continue to invest in their strength, relevance and
appeal year after year. We do this because we
understand the value that strong brands return to
our guests, team members, franchisees, shareholders,
and communities. It’s the value of reputation,
connection, consistency, relevance, and a balanced
approach to generating top- and bottom-line growth.
A balanced approach to capital management
In all that we do, we maintain a disciplined focus
on value creation, which enables us to reduce risk
and return capital to our shareholders. This approach
remains a cornerstone of our financial strategy, and
in 2014, we executed against it in several key ways.
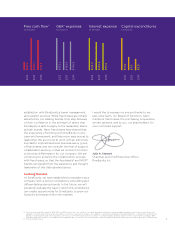
For 2014, we generated strong free cash flow9 of
approximately $113 million, returning a combined
total of nearly $75 million,
10 or 66% of free cash flow,
to shareholders in the form of dividends and share
repurchases. The return of cash to shareholders was
accomplished in two parts—first, by increasing the
quarterly cash dividend by a meaningful 17%, which
was effective with the dividend for the fourth quarter
of 2014; and second, increasing the share repurchase
authorization for our common stock to $100 million
from the remaining previous authorization of
approximately $40 million. During the year ended
December 31, 2014, we repurchased 387,591 shares
of our common stock for a total of approximately
$32 million.
Our prudent approach to cost management also
yielded other financial achievements over the course
of 2014. Our stock performance continued to reach
new milestones, attaining an all-time intraday high
of $104.13 on December 30, 2014, and an all-time
interday high of $103.64 on December 31, 2014. We
also completed a $1.4 billion securitization refinancing,
which allowed DineEquity to secure a significantly
lower fixed interest rate of 4.277% for the next seven
years. We anticipate that the securitization refinancing
will yield approximately $34 million in annualized
pre-tax interest savings going forward.
Going for great
Brand reputation plays a major role when it comes
to attracting and retaining top talent within our
organization. While we can—and we do—attract
the best and brightest based upon the appeal of
the Applebee’s and IHOP brands alone, we are
also working to articulate the meaningful aspects
of DineEquity’s corporate brand to internal and
external stakeholders.
9 For fiscal 2014, “Free cash flow” for a given period was defined as cash provided by operating activities, plus receipts from notes, equipment contracts and other long-term receivables
(collectively, “long-term receivables”), less additions to property and equipment, principal payments on capital lease and financing obligations and mandatory debt service payments.
(See non-U.S. GAAP financial measure reconciliation of cash provided by operating activities to free cash flow in the Company’s 2014 Form 10-K filing.)
10 This excludes the approximately $17 million in cash dividends paid on January 9, 2015. 3